Immigrants from Germany vs Eastern European Single Father Households
COMPARE
Immigrants from Germany
Eastern European
Single Father Households
Single Father Households Comparison
Immigrants from Germany
Eastern Europeans
2.3%
SINGLE FATHER HOUSEHOLDS
82.8/ 100
METRIC RATING
153rd/ 347
METRIC RANK
2.0%
SINGLE FATHER HOUSEHOLDS
100.0/ 100
METRIC RATING
25th/ 347
METRIC RANK
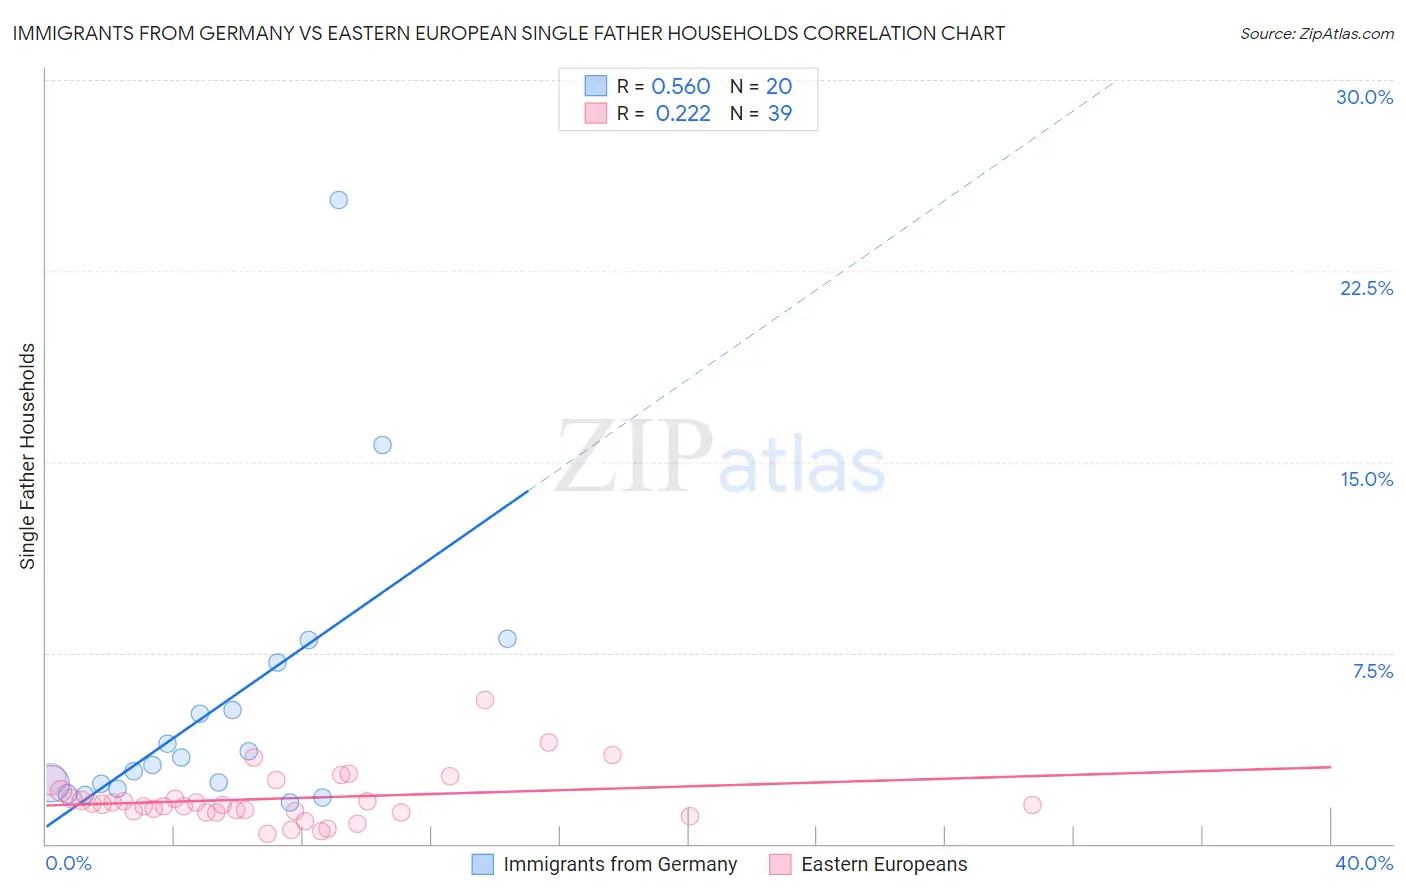
Immigrants from Germany vs Eastern European Single Father Households Correlation Chart
The statistical analysis conducted on geographies consisting of 458,347,469 people shows a substantial positive correlation between the proportion of Immigrants from Germany and percentage of single father households in the United States with a correlation coefficient (R) of 0.560 and weighted average of 2.3%. Similarly, the statistical analysis conducted on geographies consisting of 454,825,702 people shows a weak positive correlation between the proportion of Eastern Europeans and percentage of single father households in the United States with a correlation coefficient (R) of 0.222 and weighted average of 2.0%, a difference of 16.0%.
Single Father Households Correlation Summary
| Measurement | Immigrants from Germany | Eastern European |
| Minimum | 1.6% | 0.41% |
| Maximum | 25.3% | 5.6% |
| Range | 23.6% | 5.2% |
| Mean | 5.4% | 1.8% |
| Median | 3.2% | 1.5% |
| Interquartile 25% (IQ1) | 2.3% | 1.2% |
| Interquartile 75% (IQ3) | 6.2% | 2.1% |
| Interquartile Range (IQR) | 3.9% | 0.82% |
| Standard Deviation (Sample) | 5.7% | 1.0% |
| Standard Deviation (Population) | 5.6% | 1.0% |
Similar Demographics by Single Father Households
Demographics Similar to Immigrants from Germany by Single Father Households
In terms of single father households, the demographic groups most similar to Immigrants from Germany are Immigrants from Venezuela (2.3%, a difference of 0.050%), Bolivian (2.3%, a difference of 0.22%), European (2.3%, a difference of 0.24%), Immigrants from Syria (2.3%, a difference of 0.28%), and Immigrants from South America (2.3%, a difference of 0.36%).
| Demographics | Rating | Rank | Single Father Households |
| Northern Europeans | 89.8 /100 | #146 | Excellent 2.2% |
| Slavs | 88.9 /100 | #147 | Excellent 2.2% |
| South American Indians | 88.5 /100 | #148 | Excellent 2.3% |
| Senegalese | 88.4 /100 | #149 | Excellent 2.3% |
| Venezuelans | 86.2 /100 | #150 | Excellent 2.3% |
| Immigrants | Syria | 84.8 /100 | #151 | Excellent 2.3% |
| Immigrants | Venezuela | 83.2 /100 | #152 | Excellent 2.3% |
| Immigrants | Germany | 82.8 /100 | #153 | Excellent 2.3% |
| Bolivians | 81.0 /100 | #154 | Excellent 2.3% |
| Europeans | 80.9 /100 | #155 | Excellent 2.3% |
| Immigrants | South America | 79.9 /100 | #156 | Good 2.3% |
| Canadians | 79.7 /100 | #157 | Good 2.3% |
| Immigrants | Senegal | 79.4 /100 | #158 | Good 2.3% |
| Immigrants | West Indies | 77.9 /100 | #159 | Good 2.3% |
| Immigrants | Bolivia | 76.3 /100 | #160 | Good 2.3% |
Demographics Similar to Eastern Europeans by Single Father Households
In terms of single father households, the demographic groups most similar to Eastern Europeans are Immigrants from Russia (2.0%, a difference of 0.0%), Immigrants from Croatia (2.0%, a difference of 0.010%), Assyrian/Chaldean/Syriac (2.0%, a difference of 0.14%), Immigrants from South Central Asia (2.0%, a difference of 0.42%), and Immigrants from Japan (2.0%, a difference of 0.61%).
| Demographics | Rating | Rank | Single Father Households |
| Indians (Asian) | 100.0 /100 | #18 | Exceptional 1.9% |
| Iranians | 100.0 /100 | #19 | Exceptional 1.9% |
| Thais | 100.0 /100 | #20 | Exceptional 1.9% |
| Immigrants | Albania | 100.0 /100 | #21 | Exceptional 1.9% |
| Immigrants | Latvia | 100.0 /100 | #22 | Exceptional 1.9% |
| Immigrants | Croatia | 100.0 /100 | #23 | Exceptional 2.0% |
| Immigrants | Russia | 100.0 /100 | #24 | Exceptional 2.0% |
| Eastern Europeans | 100.0 /100 | #25 | Exceptional 2.0% |
| Assyrians/Chaldeans/Syriacs | 100.0 /100 | #26 | Exceptional 2.0% |
| Immigrants | South Central Asia | 100.0 /100 | #27 | Exceptional 2.0% |
| Immigrants | Japan | 100.0 /100 | #28 | Exceptional 2.0% |
| Bulgarians | 100.0 /100 | #29 | Exceptional 2.0% |
| Cambodians | 100.0 /100 | #30 | Exceptional 2.0% |
| Israelis | 100.0 /100 | #31 | Exceptional 2.0% |
| Chinese | 100.0 /100 | #32 | Exceptional 2.0% |