Immigrants from Fiji vs Iroquois Single Mother Households
COMPARE
Immigrants from Fiji
Iroquois
Single Mother Households
Single Mother Households Comparison
Immigrants from Fiji
Iroquois
6.7%
SINGLE MOTHER HOUSEHOLDS
11.9/ 100
METRIC RATING
204th/ 347
METRIC RANK
7.0%
SINGLE MOTHER HOUSEHOLDS
2.2/ 100
METRIC RATING
228th/ 347
METRIC RANK
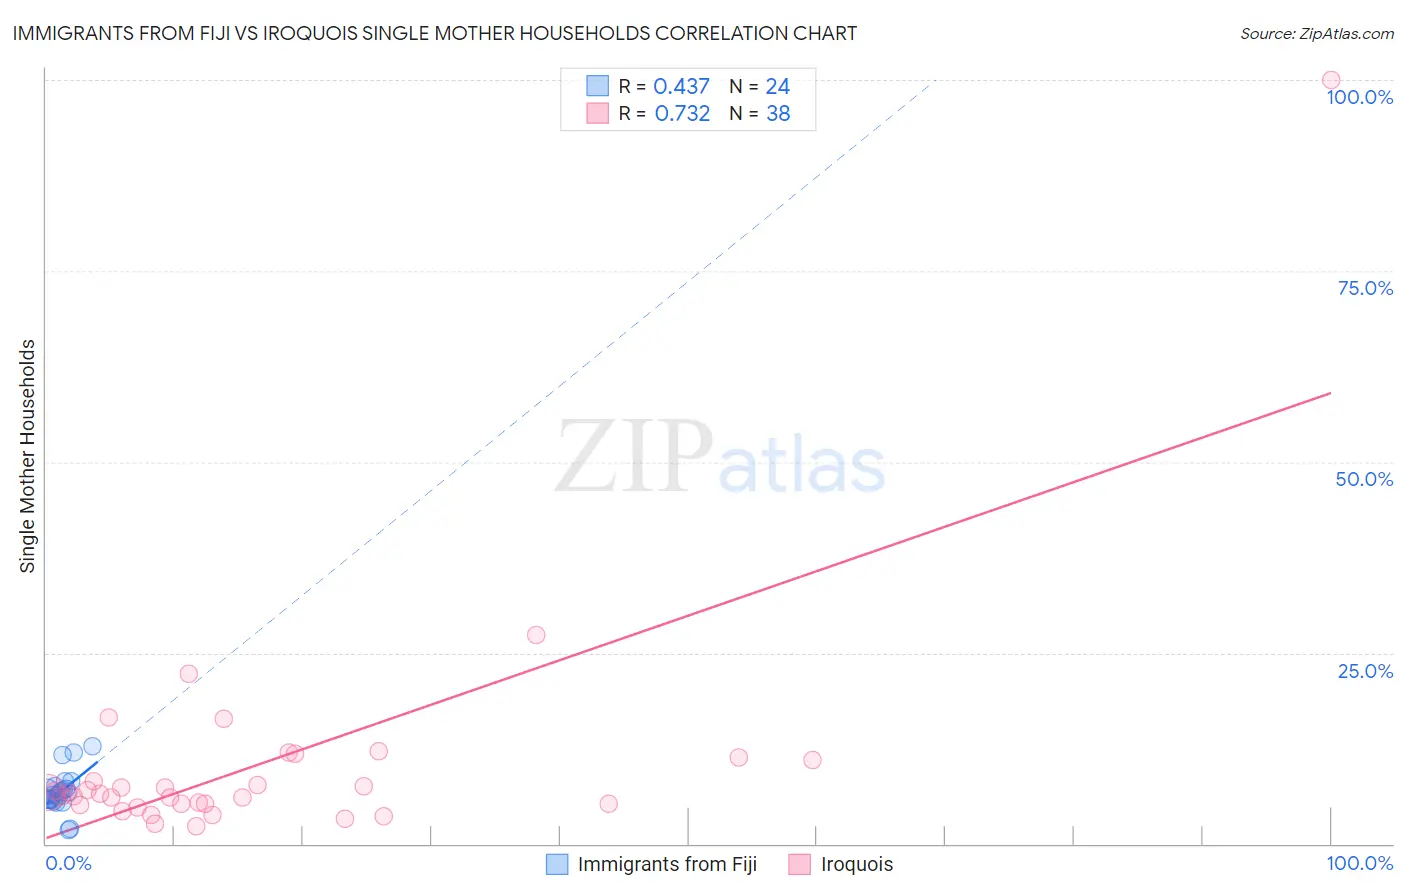
Immigrants from Fiji vs Iroquois Single Mother Households Correlation Chart
The statistical analysis conducted on geographies consisting of 93,728,014 people shows a moderate positive correlation between the proportion of Immigrants from Fiji and percentage of single mother households in the United States with a correlation coefficient (R) of 0.437 and weighted average of 6.7%. Similarly, the statistical analysis conducted on geographies consisting of 206,971,437 people shows a strong positive correlation between the proportion of Iroquois and percentage of single mother households in the United States with a correlation coefficient (R) of 0.732 and weighted average of 7.0%, a difference of 4.6%.
Single Mother Households Correlation Summary
| Measurement | Immigrants from Fiji | Iroquois |
| Minimum | 1.9% | 2.3% |
| Maximum | 12.8% | 100.0% |
| Range | 10.9% | 97.7% |
| Mean | 6.8% | 10.5% |
| Median | 6.6% | 6.6% |
| Interquartile 25% (IQ1) | 5.7% | 5.2% |
| Interquartile 75% (IQ3) | 7.4% | 11.0% |
| Interquartile Range (IQR) | 1.6% | 5.8% |
| Standard Deviation (Sample) | 2.5% | 15.8% |
| Standard Deviation (Population) | 2.5% | 15.6% |
Similar Demographics by Single Mother Households
Demographics Similar to Immigrants from Fiji by Single Mother Households
In terms of single mother households, the demographic groups most similar to Immigrants from Fiji are Immigrants from Peru (6.7%, a difference of 0.010%), Cree (6.7%, a difference of 0.020%), German Russian (6.7%, a difference of 0.10%), Immigrants from South America (6.7%, a difference of 0.10%), and Guamanian/Chamorro (6.6%, a difference of 0.11%).
| Demographics | Rating | Rank | Single Mother Households |
| Moroccans | 17.4 /100 | #197 | Poor 6.6% |
| Hawaiians | 16.1 /100 | #198 | Poor 6.6% |
| Potawatomi | 15.5 /100 | #199 | Poor 6.6% |
| Immigrants | Ethiopia | 14.7 /100 | #200 | Poor 6.6% |
| Venezuelans | 12.9 /100 | #201 | Poor 6.6% |
| Guamanians/Chamorros | 12.4 /100 | #202 | Poor 6.6% |
| Immigrants | Peru | 12.0 /100 | #203 | Poor 6.7% |
| Immigrants | Fiji | 11.9 /100 | #204 | Poor 6.7% |
| Cree | 11.9 /100 | #205 | Poor 6.7% |
| German Russians | 11.5 /100 | #206 | Poor 6.7% |
| Immigrants | South America | 11.5 /100 | #207 | Poor 6.7% |
| Vietnamese | 11.3 /100 | #208 | Poor 6.7% |
| Immigrants | Colombia | 10.5 /100 | #209 | Poor 6.7% |
| Immigrants | Nonimmigrants | 10.4 /100 | #210 | Poor 6.7% |
| Immigrants | Venezuela | 8.5 /100 | #211 | Tragic 6.7% |
Demographics Similar to Iroquois by Single Mother Households
In terms of single mother households, the demographic groups most similar to Iroquois are Kenyan (7.0%, a difference of 0.030%), Paiute (7.0%, a difference of 0.17%), Immigrants from Kenya (7.0%, a difference of 0.17%), Sudanese (6.9%, a difference of 0.85%), and Creek (7.0%, a difference of 0.88%).
| Demographics | Rating | Rank | Single Mother Households |
| French American Indians | 3.7 /100 | #221 | Tragic 6.9% |
| Immigrants | Bangladesh | 3.7 /100 | #222 | Tragic 6.9% |
| Immigrants | Micronesia | 3.6 /100 | #223 | Tragic 6.9% |
| Immigrants | Sudan | 3.5 /100 | #224 | Tragic 6.9% |
| Sudanese | 3.1 /100 | #225 | Tragic 6.9% |
| Paiute | 2.4 /100 | #226 | Tragic 7.0% |
| Kenyans | 2.3 /100 | #227 | Tragic 7.0% |
| Iroquois | 2.2 /100 | #228 | Tragic 7.0% |
| Immigrants | Kenya | 2.1 /100 | #229 | Tragic 7.0% |
| Creek | 1.6 /100 | #230 | Tragic 7.0% |
| Spanish Americans | 1.6 /100 | #231 | Tragic 7.0% |
| Comanche | 1.5 /100 | #232 | Tragic 7.0% |
| Choctaw | 1.4 /100 | #233 | Tragic 7.0% |
| Chickasaw | 1.4 /100 | #234 | Tragic 7.0% |
| Immigrants | Burma/Myanmar | 1.4 /100 | #235 | Tragic 7.0% |