Immigrants from Fiji vs Delaware Single Mother Households
COMPARE
Immigrants from Fiji
Delaware
Single Mother Households
Single Mother Households Comparison
Immigrants from Fiji
Delaware
6.7%
SINGLE MOTHER HOUSEHOLDS
11.9/ 100
METRIC RATING
204th/ 347
METRIC RANK
6.5%
SINGLE MOTHER HOUSEHOLDS
23.3/ 100
METRIC RATING
189th/ 347
METRIC RANK
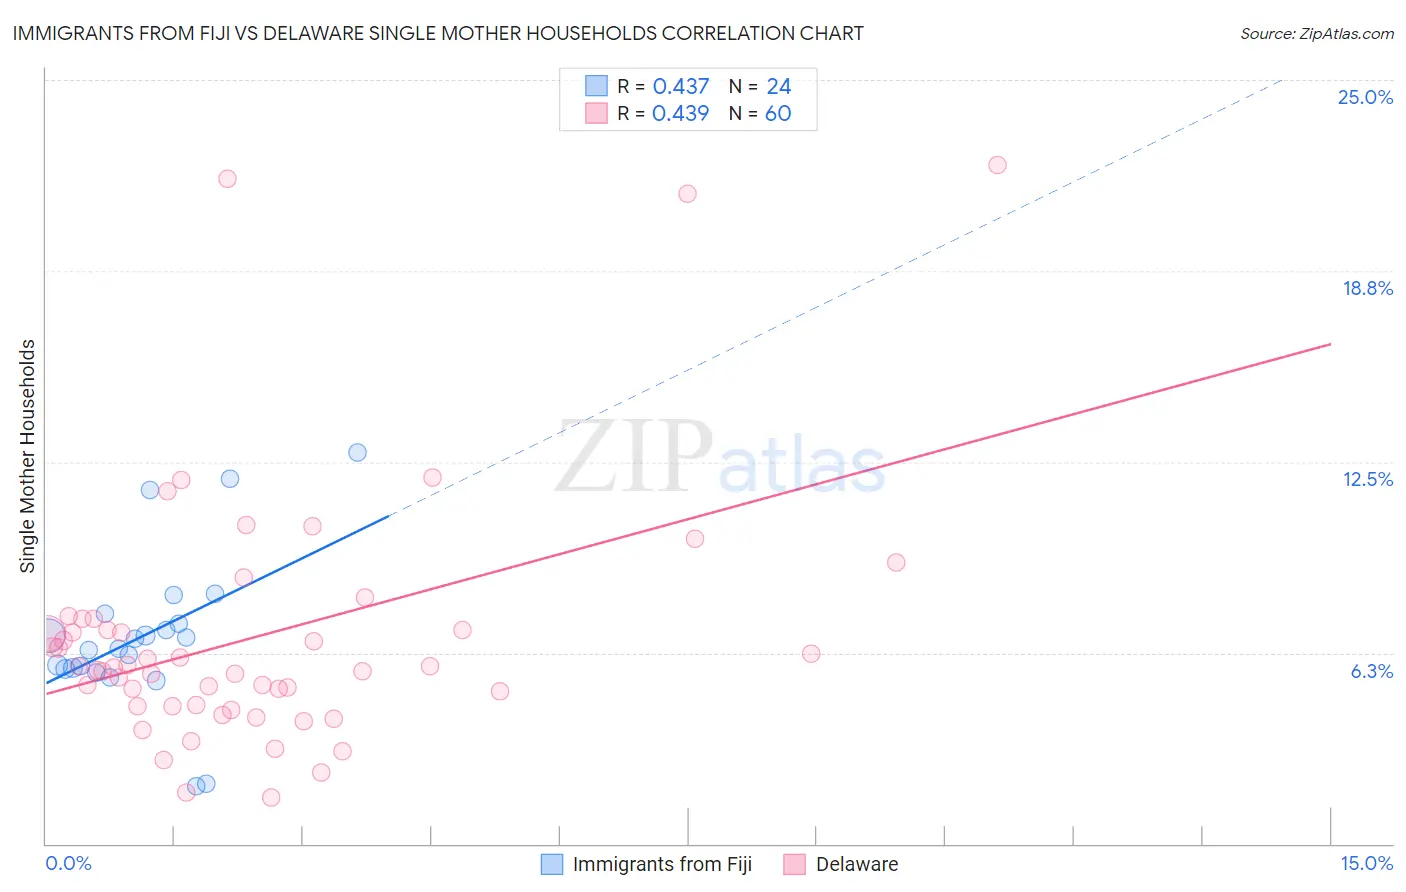
Immigrants from Fiji vs Delaware Single Mother Households Correlation Chart
The statistical analysis conducted on geographies consisting of 93,728,014 people shows a moderate positive correlation between the proportion of Immigrants from Fiji and percentage of single mother households in the United States with a correlation coefficient (R) of 0.437 and weighted average of 6.7%. Similarly, the statistical analysis conducted on geographies consisting of 96,147,855 people shows a moderate positive correlation between the proportion of Delaware and percentage of single mother households in the United States with a correlation coefficient (R) of 0.439 and weighted average of 6.5%, a difference of 2.1%.
Single Mother Households Correlation Summary
| Measurement | Immigrants from Fiji | Delaware |
| Minimum | 1.9% | 1.5% |
| Maximum | 12.8% | 22.2% |
| Range | 10.9% | 20.7% |
| Mean | 6.8% | 6.8% |
| Median | 6.6% | 5.8% |
| Interquartile 25% (IQ1) | 5.7% | 4.5% |
| Interquartile 75% (IQ3) | 7.4% | 7.2% |
| Interquartile Range (IQR) | 1.6% | 2.6% |
| Standard Deviation (Sample) | 2.5% | 4.2% |
| Standard Deviation (Population) | 2.5% | 4.1% |
Demographics Similar to Immigrants from Fiji and Delaware by Single Mother Households
In terms of single mother households, the demographic groups most similar to Immigrants from Fiji are Immigrants from Peru (6.7%, a difference of 0.010%), Cree (6.7%, a difference of 0.020%), German Russian (6.7%, a difference of 0.10%), Guamanian/Chamorro (6.6%, a difference of 0.11%), and Venezuelan (6.6%, a difference of 0.22%). Similarly, the demographic groups most similar to Delaware are Ottawa (6.5%, a difference of 0.070%), Immigrants from Afghanistan (6.5%, a difference of 0.20%), Costa Rican (6.5%, a difference of 0.21%), Peruvian (6.5%, a difference of 0.26%), and Samoan (6.5%, a difference of 0.32%).
| Demographics | Rating | Rank | Single Mother Households |
| Costa Ricans | 24.8 /100 | #186 | Fair 6.5% |
| Immigrants | Afghanistan | 24.7 /100 | #187 | Fair 6.5% |
| Ottawa | 23.8 /100 | #188 | Fair 6.5% |
| Delaware | 23.3 /100 | #189 | Fair 6.5% |
| Peruvians | 21.6 /100 | #190 | Fair 6.5% |
| Samoans | 21.2 /100 | #191 | Fair 6.5% |
| Americans | 19.0 /100 | #192 | Poor 6.6% |
| Colombians | 18.3 /100 | #193 | Poor 6.6% |
| Immigrants | Uganda | 18.3 /100 | #194 | Poor 6.6% |
| South Americans | 18.0 /100 | #195 | Poor 6.6% |
| Uruguayans | 18.0 /100 | #196 | Poor 6.6% |
| Moroccans | 17.4 /100 | #197 | Poor 6.6% |
| Hawaiians | 16.1 /100 | #198 | Poor 6.6% |
| Potawatomi | 15.5 /100 | #199 | Poor 6.6% |
| Immigrants | Ethiopia | 14.7 /100 | #200 | Poor 6.6% |
| Venezuelans | 12.9 /100 | #201 | Poor 6.6% |
| Guamanians/Chamorros | 12.4 /100 | #202 | Poor 6.6% |
| Immigrants | Peru | 12.0 /100 | #203 | Poor 6.7% |
| Immigrants | Fiji | 11.9 /100 | #204 | Poor 6.7% |
| Cree | 11.9 /100 | #205 | Poor 6.7% |
| German Russians | 11.5 /100 | #206 | Poor 6.7% |