Immigrants from Egypt vs Native/Alaskan Average Family Size
COMPARE
Immigrants from Egypt
Native/Alaskan
Average Family Size
Average Family Size Comparison
Immigrants from Egypt
Natives/Alaskans
3.24
AVERAGE FAMILY SIZE
70.0/ 100
METRIC RATING
154th/ 347
METRIC RANK
3.45
AVERAGE FAMILY SIZE
100.0/ 100
METRIC RATING
24th/ 347
METRIC RANK
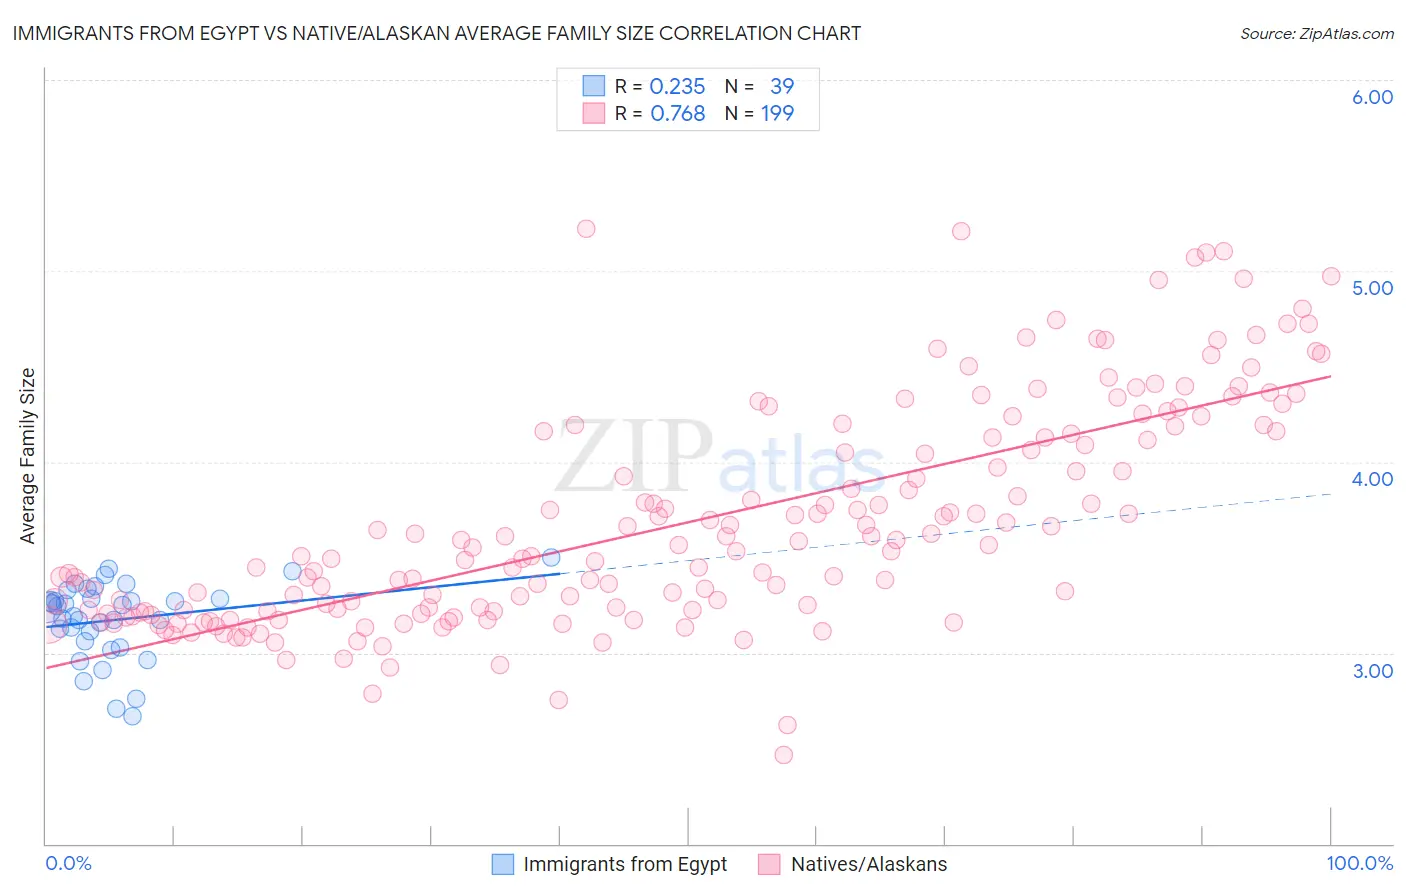
Immigrants from Egypt vs Native/Alaskan Average Family Size Correlation Chart
The statistical analysis conducted on geographies consisting of 245,429,769 people shows a weak positive correlation between the proportion of Immigrants from Egypt and average family size in the United States with a correlation coefficient (R) of 0.235 and weighted average of 3.24. Similarly, the statistical analysis conducted on geographies consisting of 512,654,103 people shows a strong positive correlation between the proportion of Natives/Alaskans and average family size in the United States with a correlation coefficient (R) of 0.768 and weighted average of 3.45, a difference of 6.4%.
Average Family Size Correlation Summary
| Measurement | Immigrants from Egypt | Native/Alaskan |
| Minimum | 2.67 | 2.46 |
| Maximum | 3.50 | 5.22 |
| Range | 0.83 | 2.76 |
| Mean | 3.17 | 3.68 |
| Median | 3.24 | 3.53 |
| Interquartile 25% (IQ1) | 3.06 | 3.22 |
| Interquartile 75% (IQ3) | 3.28 | 4.15 |
| Interquartile Range (IQR) | 0.22 | 0.93 |
| Standard Deviation (Sample) | 0.20 | 0.58 |
| Standard Deviation (Population) | 0.20 | 0.58 |
Similar Demographics by Average Family Size
Demographics Similar to Immigrants from Egypt by Average Family Size
In terms of average family size, the demographic groups most similar to Immigrants from Egypt are Immigrants from Eritrea (3.24, a difference of 0.030%), Seminole (3.24, a difference of 0.040%), Immigrants from Taiwan (3.24, a difference of 0.040%), Spanish American (3.24, a difference of 0.060%), and Immigrants from Uzbekistan (3.24, a difference of 0.060%).
| Demographics | Rating | Rank | Average Family Size |
| Immigrants | Jordan | 75.7 /100 | #147 | Good 3.24 |
| Blackfeet | 75.0 /100 | #148 | Good 3.24 |
| Assyrians/Chaldeans/Syriacs | 73.8 /100 | #149 | Good 3.24 |
| Indians (Asian) | 73.6 /100 | #150 | Good 3.24 |
| Jordanians | 73.5 /100 | #151 | Good 3.24 |
| Spanish Americans | 72.5 /100 | #152 | Good 3.24 |
| Immigrants | Eritrea | 71.4 /100 | #153 | Good 3.24 |
| Immigrants | Egypt | 70.0 /100 | #154 | Good 3.24 |
| Seminole | 68.2 /100 | #155 | Good 3.24 |
| Immigrants | Taiwan | 68.1 /100 | #156 | Good 3.24 |
| Immigrants | Uzbekistan | 67.0 /100 | #157 | Good 3.24 |
| Iraqis | 64.3 /100 | #158 | Good 3.24 |
| Ethiopians | 63.9 /100 | #159 | Good 3.24 |
| Immigrants | Iraq | 63.7 /100 | #160 | Good 3.24 |
| Immigrants | Chile | 63.2 /100 | #161 | Good 3.24 |
Demographics Similar to Natives/Alaskans by Average Family Size
In terms of average family size, the demographic groups most similar to Natives/Alaskans are Yakama (3.45, a difference of 0.11%), Immigrants from Fiji (3.45, a difference of 0.12%), Apache (3.46, a difference of 0.41%), Yuman (3.47, a difference of 0.47%), and Native Hawaiian (3.43, a difference of 0.62%).
| Demographics | Rating | Rank | Average Family Size |
| Immigrants | El Salvador | 100.0 /100 | #17 | Exceptional 3.49 |
| Salvadorans | 100.0 /100 | #18 | Exceptional 3.48 |
| Mexicans | 100.0 /100 | #19 | Exceptional 3.48 |
| Cheyenne | 100.0 /100 | #20 | Exceptional 3.47 |
| Yuman | 100.0 /100 | #21 | Exceptional 3.47 |
| Apache | 100.0 /100 | #22 | Exceptional 3.46 |
| Immigrants | Fiji | 100.0 /100 | #23 | Exceptional 3.45 |
| Natives/Alaskans | 100.0 /100 | #24 | Exceptional 3.45 |
| Yakama | 100.0 /100 | #25 | Exceptional 3.45 |
| Native Hawaiians | 100.0 /100 | #26 | Exceptional 3.43 |
| Mexican American Indians | 100.0 /100 | #27 | Exceptional 3.43 |
| Immigrants | Latin America | 100.0 /100 | #28 | Exceptional 3.42 |
| Nepalese | 100.0 /100 | #29 | Exceptional 3.42 |
| Samoans | 100.0 /100 | #30 | Exceptional 3.42 |
| Central Americans | 100.0 /100 | #31 | Exceptional 3.41 |