Immigrants from Colombia vs Native/Alaskan Average Family Size
COMPARE
Immigrants from Colombia
Native/Alaskan
Average Family Size
Average Family Size Comparison
Immigrants from Colombia
Natives/Alaskans
3.27
AVERAGE FAMILY SIZE
92.8/ 100
METRIC RATING
122nd/ 347
METRIC RANK
3.45
AVERAGE FAMILY SIZE
100.0/ 100
METRIC RATING
24th/ 347
METRIC RANK
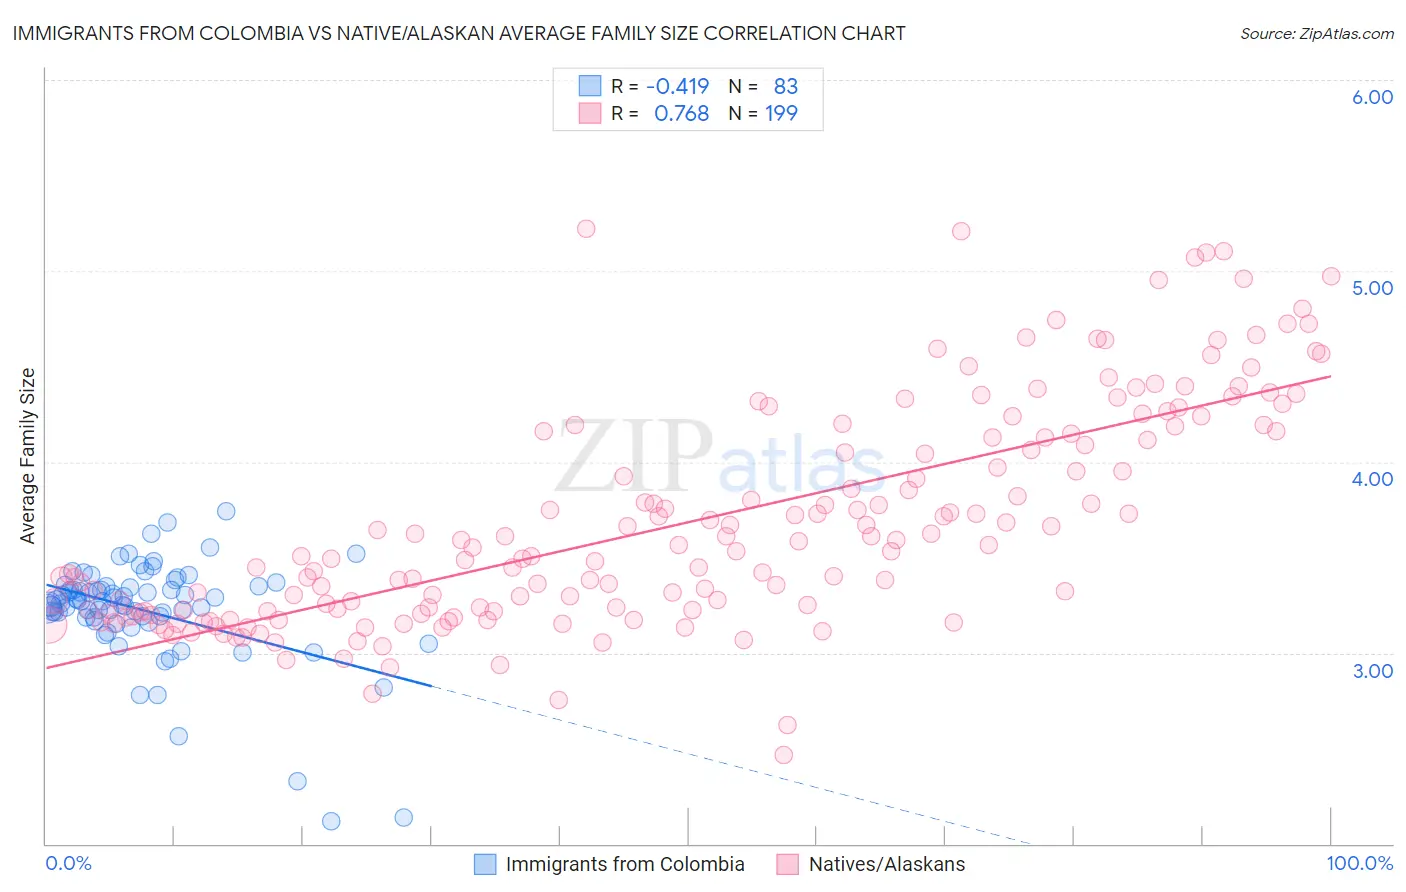
Immigrants from Colombia vs Native/Alaskan Average Family Size Correlation Chart
The statistical analysis conducted on geographies consisting of 378,535,546 people shows a moderate negative correlation between the proportion of Immigrants from Colombia and average family size in the United States with a correlation coefficient (R) of -0.419 and weighted average of 3.27. Similarly, the statistical analysis conducted on geographies consisting of 512,654,103 people shows a strong positive correlation between the proportion of Natives/Alaskans and average family size in the United States with a correlation coefficient (R) of 0.768 and weighted average of 3.45, a difference of 5.6%.
Average Family Size Correlation Summary
| Measurement | Immigrants from Colombia | Native/Alaskan |
| Minimum | 2.12 | 2.46 |
| Maximum | 3.74 | 5.22 |
| Range | 1.62 | 2.76 |
| Mean | 3.22 | 3.68 |
| Median | 3.27 | 3.53 |
| Interquartile 25% (IQ1) | 3.18 | 3.22 |
| Interquartile 75% (IQ3) | 3.35 | 4.15 |
| Interquartile Range (IQR) | 0.17 | 0.93 |
| Standard Deviation (Sample) | 0.28 | 0.58 |
| Standard Deviation (Population) | 0.27 | 0.58 |
Similar Demographics by Average Family Size
Demographics Similar to Immigrants from Colombia by Average Family Size
In terms of average family size, the demographic groups most similar to Immigrants from Colombia are Alaskan Athabascan (3.27, a difference of 0.020%), Immigrants from Thailand (3.27, a difference of 0.030%), Immigrants from Bahamas (3.27, a difference of 0.060%), Immigrants from Indonesia (3.27, a difference of 0.070%), and South American Indian (3.26, a difference of 0.070%).
| Demographics | Rating | Rank | Average Family Size |
| Immigrants | Liberia | 95.0 /100 | #115 | Exceptional 3.27 |
| Immigrants | South America | 95.0 /100 | #116 | Exceptional 3.27 |
| Kiowa | 94.8 /100 | #117 | Exceptional 3.27 |
| Immigrants | Asia | 94.0 /100 | #118 | Exceptional 3.27 |
| Immigrants | Indonesia | 93.7 /100 | #119 | Exceptional 3.27 |
| Immigrants | Bahamas | 93.6 /100 | #120 | Exceptional 3.27 |
| Immigrants | Thailand | 93.3 /100 | #121 | Exceptional 3.27 |
| Immigrants | Colombia | 92.8 /100 | #122 | Exceptional 3.27 |
| Alaskan Athabascans | 92.4 /100 | #123 | Exceptional 3.27 |
| South American Indians | 91.6 /100 | #124 | Exceptional 3.26 |
| Immigrants | Cuba | 91.3 /100 | #125 | Exceptional 3.26 |
| Immigrants | Costa Rica | 90.7 /100 | #126 | Exceptional 3.26 |
| Immigrants | Syria | 90.6 /100 | #127 | Exceptional 3.26 |
| Colombians | 89.9 /100 | #128 | Excellent 3.26 |
| Immigrants | Hong Kong | 88.6 /100 | #129 | Excellent 3.26 |
Demographics Similar to Natives/Alaskans by Average Family Size
In terms of average family size, the demographic groups most similar to Natives/Alaskans are Yakama (3.45, a difference of 0.11%), Immigrants from Fiji (3.45, a difference of 0.12%), Apache (3.46, a difference of 0.41%), Yuman (3.47, a difference of 0.47%), and Native Hawaiian (3.43, a difference of 0.62%).
| Demographics | Rating | Rank | Average Family Size |
| Immigrants | El Salvador | 100.0 /100 | #17 | Exceptional 3.49 |
| Salvadorans | 100.0 /100 | #18 | Exceptional 3.48 |
| Mexicans | 100.0 /100 | #19 | Exceptional 3.48 |
| Cheyenne | 100.0 /100 | #20 | Exceptional 3.47 |
| Yuman | 100.0 /100 | #21 | Exceptional 3.47 |
| Apache | 100.0 /100 | #22 | Exceptional 3.46 |
| Immigrants | Fiji | 100.0 /100 | #23 | Exceptional 3.45 |
| Natives/Alaskans | 100.0 /100 | #24 | Exceptional 3.45 |
| Yakama | 100.0 /100 | #25 | Exceptional 3.45 |
| Native Hawaiians | 100.0 /100 | #26 | Exceptional 3.43 |
| Mexican American Indians | 100.0 /100 | #27 | Exceptional 3.43 |
| Immigrants | Latin America | 100.0 /100 | #28 | Exceptional 3.42 |
| Nepalese | 100.0 /100 | #29 | Exceptional 3.42 |
| Samoans | 100.0 /100 | #30 | Exceptional 3.42 |
| Central Americans | 100.0 /100 | #31 | Exceptional 3.41 |