Immigrants from Costa Rica vs Marshallese Divorced or Separated
COMPARE
Immigrants from Costa Rica
Marshallese
Divorced or Separated
Divorced or Separated Comparison
Immigrants from Costa Rica
Marshallese
12.2%
DIVORCED OR SEPARATED
21.3/ 100
METRIC RATING
205th/ 347
METRIC RANK
12.0%
DIVORCED OR SEPARATED
64.6/ 100
METRIC RATING
161st/ 347
METRIC RANK
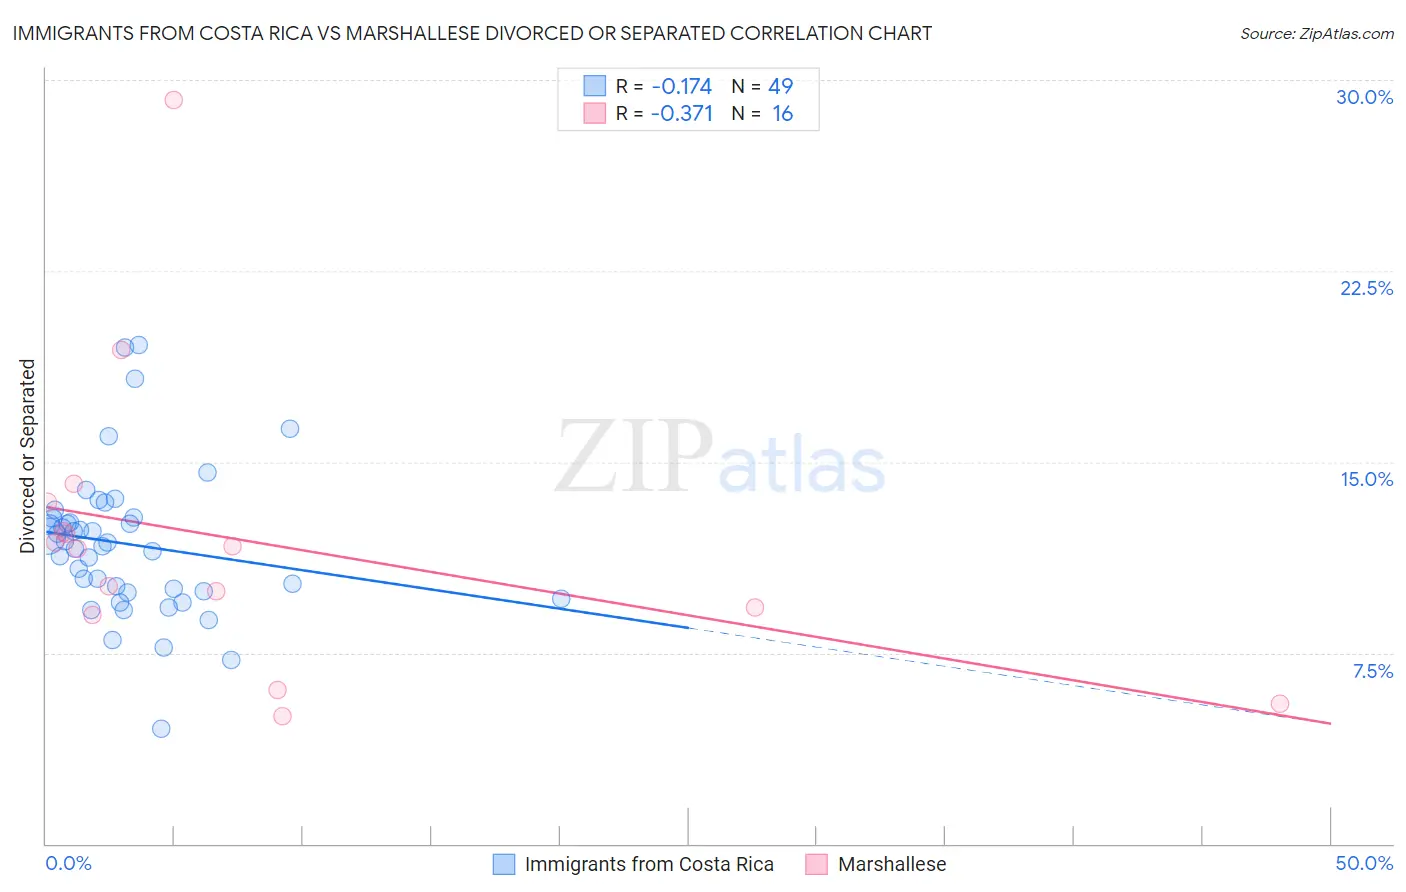
Immigrants from Costa Rica vs Marshallese Divorced or Separated Correlation Chart
The statistical analysis conducted on geographies consisting of 204,241,125 people shows a poor negative correlation between the proportion of Immigrants from Costa Rica and percentage of population currently divorced or separated in the United States with a correlation coefficient (R) of -0.174 and weighted average of 12.2%. Similarly, the statistical analysis conducted on geographies consisting of 14,761,315 people shows a mild negative correlation between the proportion of Marshallese and percentage of population currently divorced or separated in the United States with a correlation coefficient (R) of -0.371 and weighted average of 12.0%, a difference of 1.7%.
Divorced or Separated Correlation Summary
| Measurement | Immigrants from Costa Rica | Marshallese |
| Minimum | 4.5% | 5.0% |
| Maximum | 19.6% | 29.2% |
| Range | 15.0% | 24.2% |
| Mean | 11.8% | 11.9% |
| Median | 11.8% | 11.7% |
| Interquartile 25% (IQ1) | 9.9% | 9.1% |
| Interquartile 75% (IQ3) | 12.8% | 12.8% |
| Interquartile Range (IQR) | 2.9% | 3.7% |
| Standard Deviation (Sample) | 2.9% | 5.8% |
| Standard Deviation (Population) | 2.9% | 5.6% |
Similar Demographics by Divorced or Separated
Demographics Similar to Immigrants from Costa Rica by Divorced or Separated
In terms of divorced or separated, the demographic groups most similar to Immigrants from Costa Rica are Slovak (12.2%, a difference of 0.010%), Mexican (12.2%, a difference of 0.010%), Kenyan (12.2%, a difference of 0.030%), Immigrants from Guatemala (12.2%, a difference of 0.10%), and Portuguese (12.2%, a difference of 0.11%).
| Demographics | Rating | Rank | Divorced or Separated |
| Nigerians | 30.1 /100 | #198 | Fair 12.1% |
| Central Americans | 29.4 /100 | #199 | Fair 12.1% |
| South Americans | 28.6 /100 | #200 | Fair 12.2% |
| Guatemalans | 26.9 /100 | #201 | Fair 12.2% |
| Portuguese | 23.5 /100 | #202 | Fair 12.2% |
| Immigrants | Guatemala | 23.2 /100 | #203 | Fair 12.2% |
| Kenyans | 21.8 /100 | #204 | Fair 12.2% |
| Immigrants | Costa Rica | 21.3 /100 | #205 | Fair 12.2% |
| Slovaks | 21.0 /100 | #206 | Fair 12.2% |
| Mexicans | 21.0 /100 | #207 | Fair 12.2% |
| Immigrants | Ghana | 18.8 /100 | #208 | Poor 12.2% |
| Immigrants | Trinidad and Tobago | 17.8 /100 | #209 | Poor 12.2% |
| Slavs | 17.0 /100 | #210 | Poor 12.2% |
| Trinidadians and Tobagonians | 16.6 /100 | #211 | Poor 12.2% |
| Immigrants | Kenya | 16.5 /100 | #212 | Poor 12.2% |
Demographics Similar to Marshallese by Divorced or Separated
In terms of divorced or separated, the demographic groups most similar to Marshallese are Samoan (12.0%, a difference of 0.010%), Navajo (12.0%, a difference of 0.030%), Immigrants from Scotland (12.0%, a difference of 0.040%), Swiss (12.0%, a difference of 0.040%), and Immigrants from Barbados (12.0%, a difference of 0.050%).
| Demographics | Rating | Rank | Divorced or Separated |
| Chileans | 71.3 /100 | #154 | Good 12.0% |
| Japanese | 70.9 /100 | #155 | Good 12.0% |
| Hungarians | 70.3 /100 | #156 | Good 12.0% |
| Immigrants | Brazil | 68.8 /100 | #157 | Good 12.0% |
| Icelanders | 66.0 /100 | #158 | Good 12.0% |
| Immigrants | Barbados | 66.0 /100 | #159 | Good 12.0% |
| Immigrants | Scotland | 65.8 /100 | #160 | Good 12.0% |
| Marshallese | 64.6 /100 | #161 | Good 12.0% |
| Samoans | 64.3 /100 | #162 | Good 12.0% |
| Navajo | 63.9 /100 | #163 | Good 12.0% |
| Swiss | 63.6 /100 | #164 | Good 12.0% |
| German Russians | 61.8 /100 | #165 | Good 12.0% |
| Tohono O'odham | 60.4 /100 | #166 | Good 12.0% |
| Ethiopians | 58.5 /100 | #167 | Average 12.0% |
| Serbians | 57.1 /100 | #168 | Average 12.0% |