Immigrants from Armenia vs Marshallese Divorced or Separated
COMPARE
Immigrants from Armenia
Marshallese
Divorced or Separated
Divorced or Separated Comparison
Immigrants from Armenia
Marshallese
10.6%
DIVORCED OR SEPARATED
100.0/ 100
METRIC RATING
15th/ 347
METRIC RANK
12.0%
DIVORCED OR SEPARATED
64.6/ 100
METRIC RATING
161st/ 347
METRIC RANK
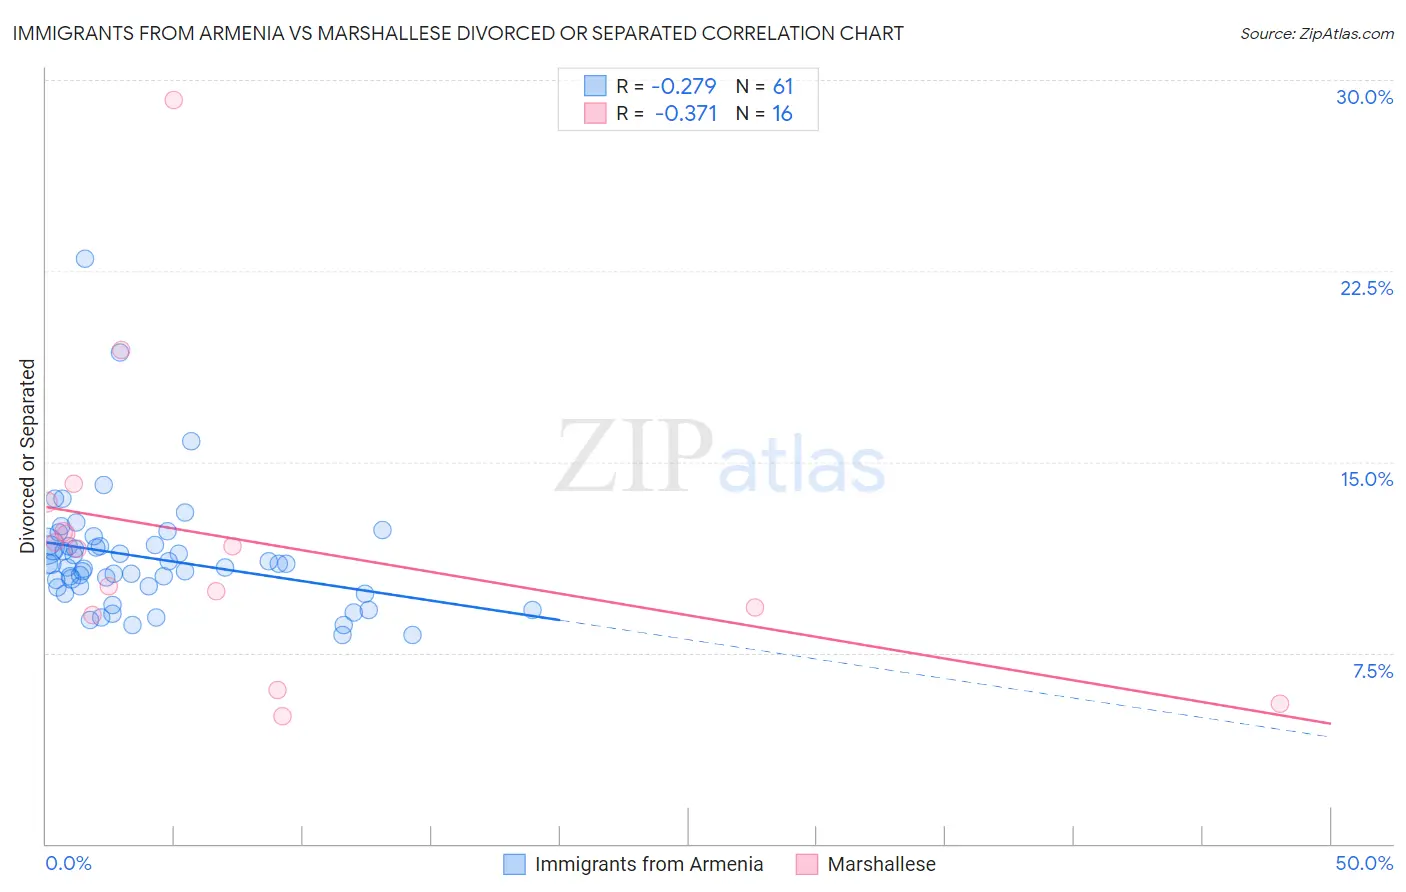
Immigrants from Armenia vs Marshallese Divorced or Separated Correlation Chart
The statistical analysis conducted on geographies consisting of 97,716,908 people shows a weak negative correlation between the proportion of Immigrants from Armenia and percentage of population currently divorced or separated in the United States with a correlation coefficient (R) of -0.279 and weighted average of 10.6%. Similarly, the statistical analysis conducted on geographies consisting of 14,761,315 people shows a mild negative correlation between the proportion of Marshallese and percentage of population currently divorced or separated in the United States with a correlation coefficient (R) of -0.371 and weighted average of 12.0%, a difference of 13.5%.
Divorced or Separated Correlation Summary
| Measurement | Immigrants from Armenia | Marshallese |
| Minimum | 8.2% | 5.0% |
| Maximum | 23.0% | 29.2% |
| Range | 14.8% | 24.2% |
| Mean | 11.2% | 11.9% |
| Median | 11.0% | 11.7% |
| Interquartile 25% (IQ1) | 10.1% | 9.1% |
| Interquartile 75% (IQ3) | 11.7% | 12.8% |
| Interquartile Range (IQR) | 1.6% | 3.7% |
| Standard Deviation (Sample) | 2.4% | 5.8% |
| Standard Deviation (Population) | 2.4% | 5.6% |
Similar Demographics by Divorced or Separated
Demographics Similar to Immigrants from Armenia by Divorced or Separated
In terms of divorced or separated, the demographic groups most similar to Immigrants from Armenia are Assyrian/Chaldean/Syriac (10.6%, a difference of 0.070%), Immigrants from Korea (10.6%, a difference of 0.44%), Immigrants from Israel (10.6%, a difference of 0.55%), Immigrants from Iran (10.6%, a difference of 0.63%), and Asian (10.6%, a difference of 0.64%).
| Demographics | Rating | Rank | Divorced or Separated |
| Immigrants | Eastern Asia | 100.0 /100 | #8 | Exceptional 10.2% |
| Yup'ik | 100.0 /100 | #9 | Exceptional 10.3% |
| Immigrants | Singapore | 100.0 /100 | #10 | Exceptional 10.3% |
| Immigrants | South Central Asia | 100.0 /100 | #11 | Exceptional 10.4% |
| Okinawans | 100.0 /100 | #12 | Exceptional 10.5% |
| Cypriots | 100.0 /100 | #13 | Exceptional 10.5% |
| Assyrians/Chaldeans/Syriacs | 100.0 /100 | #14 | Exceptional 10.6% |
| Immigrants | Armenia | 100.0 /100 | #15 | Exceptional 10.6% |
| Immigrants | Korea | 100.0 /100 | #16 | Exceptional 10.6% |
| Immigrants | Israel | 100.0 /100 | #17 | Exceptional 10.6% |
| Immigrants | Iran | 100.0 /100 | #18 | Exceptional 10.6% |
| Asians | 100.0 /100 | #19 | Exceptional 10.6% |
| Burmese | 100.0 /100 | #20 | Exceptional 10.7% |
| Immigrants | Asia | 100.0 /100 | #21 | Exceptional 10.7% |
| Vietnamese | 100.0 /100 | #22 | Exceptional 10.8% |
Demographics Similar to Marshallese by Divorced or Separated
In terms of divorced or separated, the demographic groups most similar to Marshallese are Samoan (12.0%, a difference of 0.010%), Navajo (12.0%, a difference of 0.030%), Immigrants from Scotland (12.0%, a difference of 0.040%), Swiss (12.0%, a difference of 0.040%), and Immigrants from Barbados (12.0%, a difference of 0.050%).
| Demographics | Rating | Rank | Divorced or Separated |
| Chileans | 71.3 /100 | #154 | Good 12.0% |
| Japanese | 70.9 /100 | #155 | Good 12.0% |
| Hungarians | 70.3 /100 | #156 | Good 12.0% |
| Immigrants | Brazil | 68.8 /100 | #157 | Good 12.0% |
| Icelanders | 66.0 /100 | #158 | Good 12.0% |
| Immigrants | Barbados | 66.0 /100 | #159 | Good 12.0% |
| Immigrants | Scotland | 65.8 /100 | #160 | Good 12.0% |
| Marshallese | 64.6 /100 | #161 | Good 12.0% |
| Samoans | 64.3 /100 | #162 | Good 12.0% |
| Navajo | 63.9 /100 | #163 | Good 12.0% |
| Swiss | 63.6 /100 | #164 | Good 12.0% |
| German Russians | 61.8 /100 | #165 | Good 12.0% |
| Tohono O'odham | 60.4 /100 | #166 | Good 12.0% |
| Ethiopians | 58.5 /100 | #167 | Average 12.0% |
| Serbians | 57.1 /100 | #168 | Average 12.0% |