Immigrants from Chile vs Welsh Births to Unmarried Women
COMPARE
Immigrants from Chile
Welsh
Births to Unmarried Women
Births to Unmarried Women Comparison
Immigrants from Chile
Welsh
31.2%
BIRTHS TO UNMARRIED WOMEN
65.7/ 100
METRIC RATING
163rd/ 347
METRIC RANK
32.0%
BIRTHS TO UNMARRIED WOMEN
38.2/ 100
METRIC RATING
186th/ 347
METRIC RANK
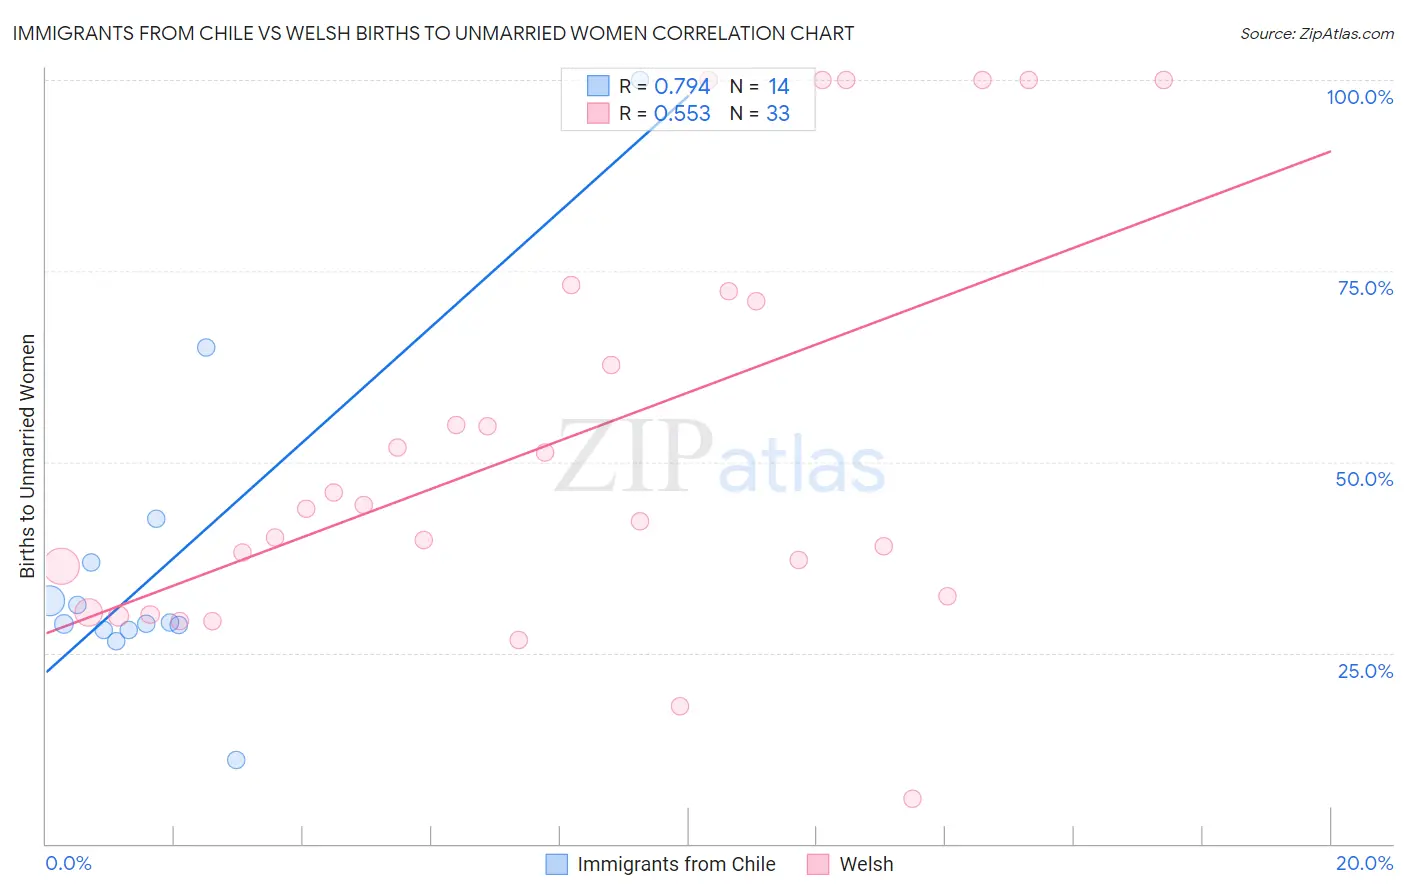
Immigrants from Chile vs Welsh Births to Unmarried Women Correlation Chart
The statistical analysis conducted on geographies consisting of 209,837,772 people shows a strong positive correlation between the proportion of Immigrants from Chile and percentage of births to unmarried women in the United States with a correlation coefficient (R) of 0.794 and weighted average of 31.2%. Similarly, the statistical analysis conducted on geographies consisting of 474,142,394 people shows a substantial positive correlation between the proportion of Welsh and percentage of births to unmarried women in the United States with a correlation coefficient (R) of 0.553 and weighted average of 32.0%, a difference of 2.7%.
Births to Unmarried Women Correlation Summary
| Measurement | Immigrants from Chile | Welsh |
| Minimum | 10.9% | 5.9% |
| Maximum | 100.0% | 100.0% |
| Range | 89.1% | 94.1% |
| Mean | 36.8% | 52.4% |
| Median | 28.9% | 43.9% |
| Interquartile 25% (IQ1) | 28.0% | 31.3% |
| Interquartile 75% (IQ3) | 36.8% | 71.7% |
| Interquartile Range (IQR) | 8.9% | 40.4% |
| Standard Deviation (Sample) | 21.6% | 27.0% |
| Standard Deviation (Population) | 20.8% | 26.6% |
Similar Demographics by Births to Unmarried Women
Demographics Similar to Immigrants from Chile by Births to Unmarried Women
In terms of births to unmarried women, the demographic groups most similar to Immigrants from Chile are Slovene (31.2%, a difference of 0.020%), Hungarian (31.2%, a difference of 0.17%), Immigrants from Southern Europe (31.1%, a difference of 0.33%), Immigrants from England (31.1%, a difference of 0.40%), and Immigrants from Western Europe (31.1%, a difference of 0.40%).
| Demographics | Rating | Rank | Births to Unmarried Women |
| Carpatho Rusyns | 73.5 /100 | #156 | Good 30.9% |
| Immigrants | Eastern Africa | 72.1 /100 | #157 | Good 31.0% |
| Austrians | 69.9 /100 | #158 | Good 31.0% |
| Immigrants | England | 69.4 /100 | #159 | Good 31.1% |
| Immigrants | Western Europe | 69.3 /100 | #160 | Good 31.1% |
| Immigrants | Southern Europe | 68.7 /100 | #161 | Good 31.1% |
| Slovenes | 65.9 /100 | #162 | Good 31.2% |
| Immigrants | Chile | 65.7 /100 | #163 | Good 31.2% |
| Hungarians | 64.1 /100 | #164 | Good 31.2% |
| Immigrants | Somalia | 58.1 /100 | #165 | Average 31.4% |
| Peruvians | 55.5 /100 | #166 | Average 31.5% |
| Dutch | 55.3 /100 | #167 | Average 31.5% |
| Belgians | 52.4 /100 | #168 | Average 31.6% |
| Slavs | 52.0 /100 | #169 | Average 31.6% |
| Guamanians/Chamorros | 51.3 /100 | #170 | Average 31.6% |
Demographics Similar to Welsh by Births to Unmarried Women
In terms of births to unmarried women, the demographic groups most similar to Welsh are Czechoslovakian (32.0%, a difference of 0.020%), Osage (32.1%, a difference of 0.11%), German (32.0%, a difference of 0.13%), Immigrants from Kenya (32.1%, a difference of 0.13%), and Immigrants from South America (32.0%, a difference of 0.24%).
| Demographics | Rating | Rank | Births to Unmarried Women |
| South Americans | 46.9 /100 | #179 | Average 31.8% |
| Moroccans | 45.7 /100 | #180 | Average 31.8% |
| Immigrants | Peru | 45.1 /100 | #181 | Average 31.8% |
| Kenyans | 43.0 /100 | #182 | Average 31.9% |
| Canadians | 41.4 /100 | #183 | Average 31.9% |
| Immigrants | South America | 40.7 /100 | #184 | Average 32.0% |
| Germans | 39.5 /100 | #185 | Fair 32.0% |
| Welsh | 38.2 /100 | #186 | Fair 32.0% |
| Czechoslovakians | 38.0 /100 | #187 | Fair 32.0% |
| Osage | 37.1 /100 | #188 | Fair 32.1% |
| Immigrants | Kenya | 36.9 /100 | #189 | Fair 32.1% |
| Tlingit-Haida | 32.6 /100 | #190 | Fair 32.2% |
| Irish | 32.4 /100 | #191 | Fair 32.2% |
| Colombians | 31.9 /100 | #192 | Fair 32.2% |
| Fijians | 31.1 /100 | #193 | Fair 32.3% |