Immigrants from Cameroon vs Immigrants from Bangladesh Family Households
COMPARE
Immigrants from Cameroon
Immigrants from Bangladesh
Family Households
Family Households Comparison
Immigrants from Cameroon
Immigrants from Bangladesh
64.7%
FAMILY HOUSEHOLDS
84.8/ 100
METRIC RATING
141st/ 347
METRIC RANK
63.9%
FAMILY HOUSEHOLDS
11.4/ 100
METRIC RATING
208th/ 347
METRIC RANK
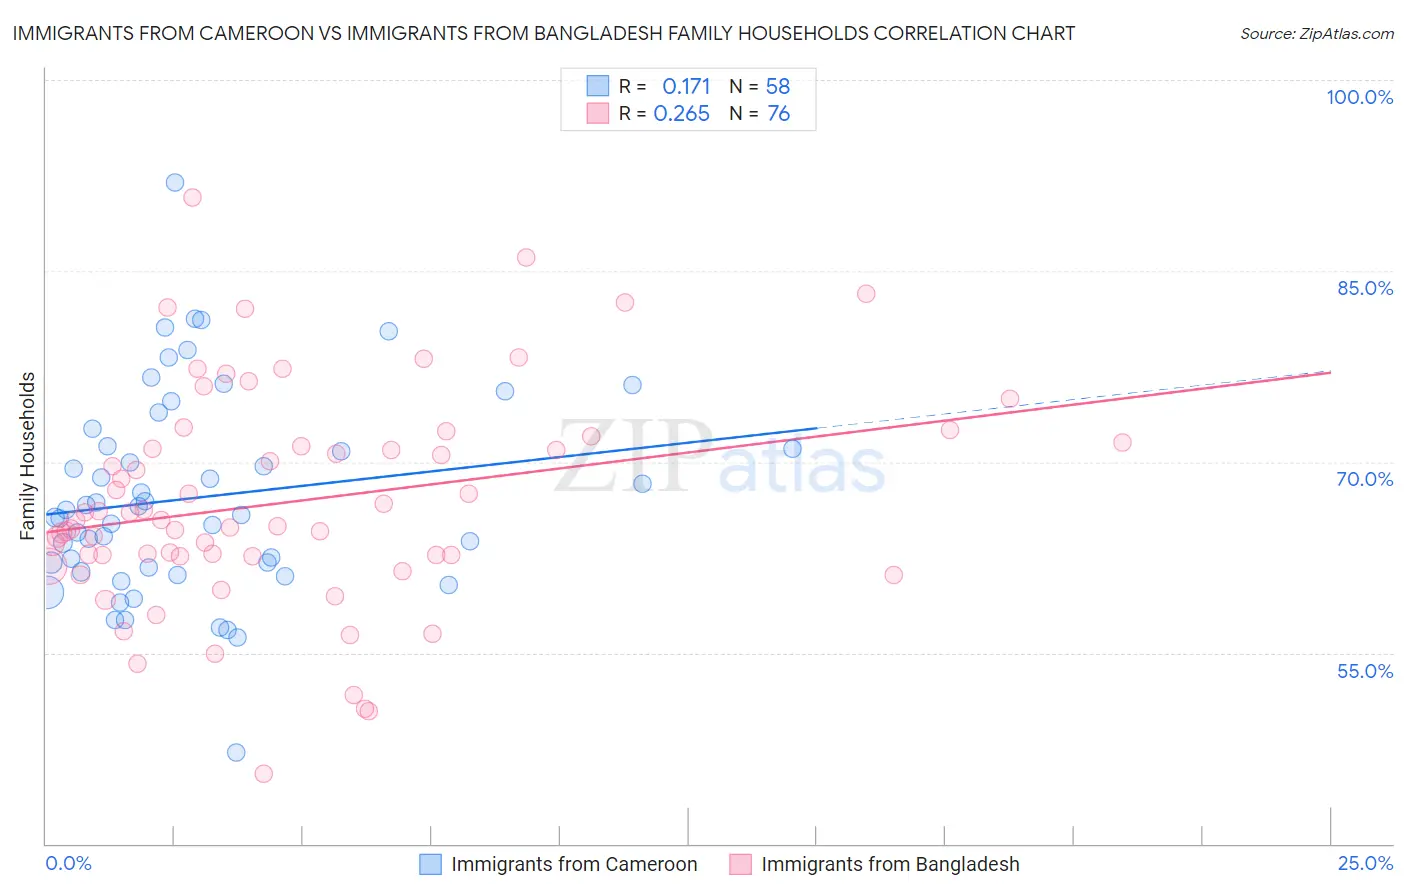
Immigrants from Cameroon vs Immigrants from Bangladesh Family Households Correlation Chart
The statistical analysis conducted on geographies consisting of 130,734,594 people shows a poor positive correlation between the proportion of Immigrants from Cameroon and percentage of family households in the United States with a correlation coefficient (R) of 0.171 and weighted average of 64.7%. Similarly, the statistical analysis conducted on geographies consisting of 203,582,618 people shows a weak positive correlation between the proportion of Immigrants from Bangladesh and percentage of family households in the United States with a correlation coefficient (R) of 0.265 and weighted average of 63.9%, a difference of 1.3%.
Family Households Correlation Summary
| Measurement | Immigrants from Cameroon | Immigrants from Bangladesh |
| Minimum | 47.1% | 45.5% |
| Maximum | 92.0% | 90.8% |
| Range | 44.8% | 45.3% |
| Mean | 67.2% | 66.9% |
| Median | 66.0% | 65.4% |
| Interquartile 25% (IQ1) | 61.7% | 62.6% |
| Interquartile 75% (IQ3) | 71.3% | 71.3% |
| Interquartile Range (IQR) | 9.5% | 8.7% |
| Standard Deviation (Sample) | 8.0% | 8.5% |
| Standard Deviation (Population) | 7.9% | 8.5% |
Similar Demographics by Family Households
Demographics Similar to Immigrants from Cameroon by Family Households
In terms of family households, the demographic groups most similar to Immigrants from Cameroon are Immigrants from North Macedonia (64.7%, a difference of 0.0%), Immigrants from Jamaica (64.7%, a difference of 0.010%), Basque (64.7%, a difference of 0.020%), Pakistani (64.7%, a difference of 0.020%), and Immigrants from Scotland (64.7%, a difference of 0.040%).
| Demographics | Rating | Rank | Family Households |
| Greeks | 88.1 /100 | #134 | Excellent 64.7% |
| Maltese | 87.4 /100 | #135 | Excellent 64.7% |
| Immigrants | China | 86.6 /100 | #136 | Excellent 64.7% |
| Immigrants | Scotland | 86.4 /100 | #137 | Excellent 64.7% |
| Basques | 85.5 /100 | #138 | Excellent 64.7% |
| Immigrants | Jamaica | 85.3 /100 | #139 | Excellent 64.7% |
| Immigrants | North Macedonia | 84.9 /100 | #140 | Excellent 64.7% |
| Immigrants | Cameroon | 84.8 /100 | #141 | Excellent 64.7% |
| Pakistanis | 84.0 /100 | #142 | Excellent 64.7% |
| Czechoslovakians | 82.1 /100 | #143 | Excellent 64.6% |
| South American Indians | 81.9 /100 | #144 | Excellent 64.6% |
| Welsh | 80.1 /100 | #145 | Excellent 64.6% |
| Immigrants | Romania | 77.0 /100 | #146 | Good 64.6% |
| Immigrants | Chile | 76.5 /100 | #147 | Good 64.6% |
| Delaware | 76.3 /100 | #148 | Good 64.6% |
Demographics Similar to Immigrants from Bangladesh by Family Households
In terms of family households, the demographic groups most similar to Immigrants from Bangladesh are Nigerian (63.9%, a difference of 0.0%), Sierra Leonean (63.9%, a difference of 0.010%), Immigrants from Lithuania (63.9%, a difference of 0.020%), Brazilian (63.9%, a difference of 0.030%), and Immigrants from Uruguay (63.9%, a difference of 0.040%).
| Demographics | Rating | Rank | Family Households |
| Immigrants | Eastern Europe | 17.2 /100 | #201 | Poor 64.0% |
| Iranians | 13.5 /100 | #202 | Poor 63.9% |
| Norwegians | 13.2 /100 | #203 | Poor 63.9% |
| Immigrants | Uruguay | 12.8 /100 | #204 | Poor 63.9% |
| Brazilians | 12.4 /100 | #205 | Poor 63.9% |
| Immigrants | Lithuania | 12.1 /100 | #206 | Poor 63.9% |
| Nigerians | 11.5 /100 | #207 | Poor 63.9% |
| Immigrants | Bangladesh | 11.4 /100 | #208 | Poor 63.9% |
| Sierra Leoneans | 11.2 /100 | #209 | Poor 63.9% |
| Immigrants | Thailand | 9.6 /100 | #210 | Tragic 63.8% |
| Shoshone | 9.4 /100 | #211 | Tragic 63.8% |
| Immigrants | Netherlands | 9.4 /100 | #212 | Tragic 63.8% |
| Immigrants | Northern Europe | 8.8 /100 | #213 | Tragic 63.8% |
| Celtics | 8.0 /100 | #214 | Tragic 63.8% |
| Belgians | 7.6 /100 | #215 | Tragic 63.8% |