Immigrants from Cabo Verde vs Osage Divorced or Separated
COMPARE
Immigrants from Cabo Verde
Osage
Divorced or Separated
Divorced or Separated Comparison
Immigrants from Cabo Verde
Osage
13.1%
DIVORCED OR SEPARATED
0.0/ 100
METRIC RATING
300th/ 347
METRIC RANK
13.4%
DIVORCED OR SEPARATED
0.0/ 100
METRIC RATING
324th/ 347
METRIC RANK
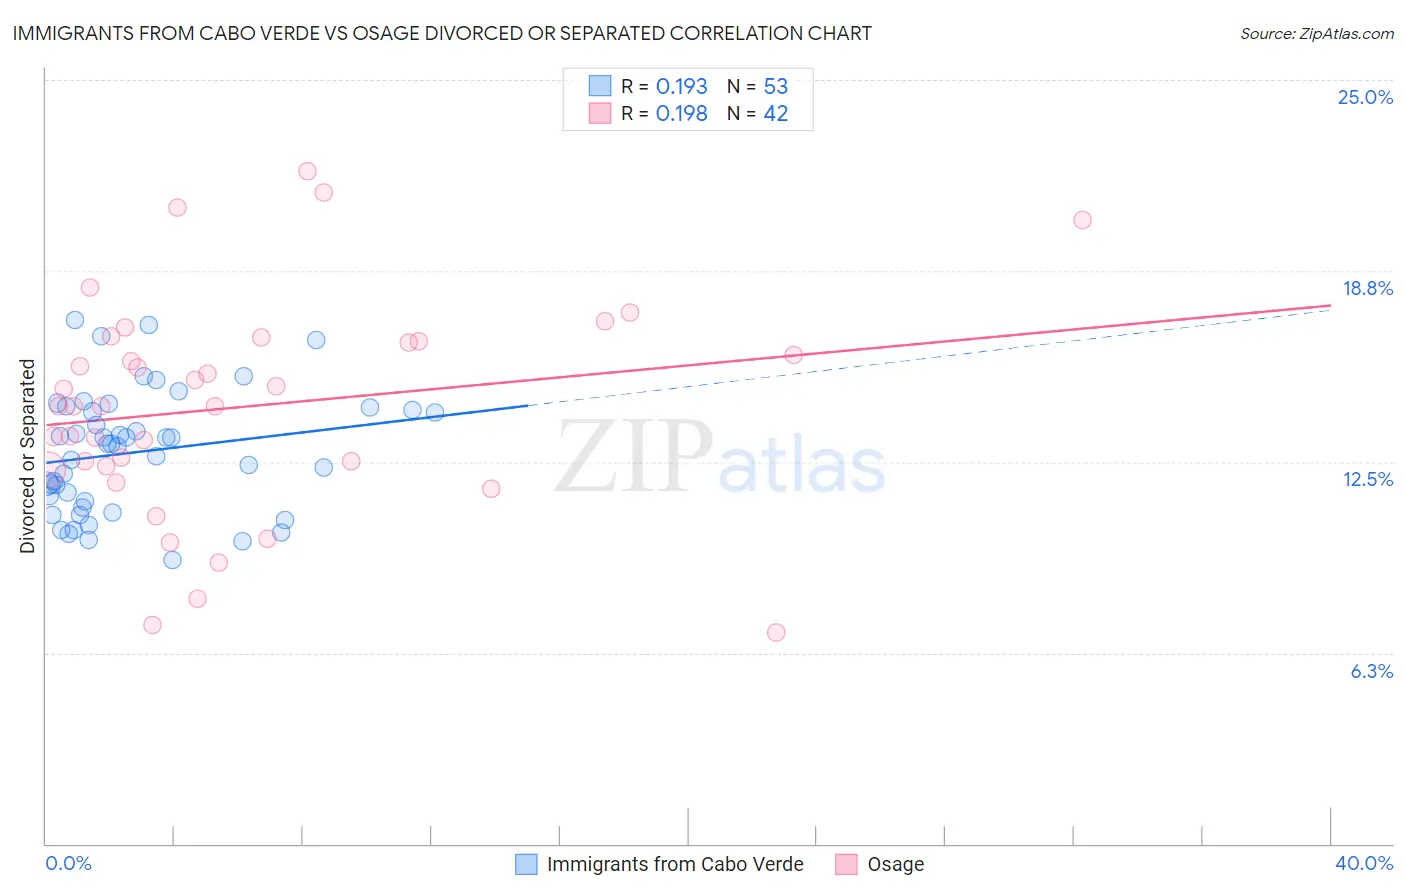
Immigrants from Cabo Verde vs Osage Divorced or Separated Correlation Chart
The statistical analysis conducted on geographies consisting of 38,154,162 people shows a poor positive correlation between the proportion of Immigrants from Cabo Verde and percentage of population currently divorced or separated in the United States with a correlation coefficient (R) of 0.193 and weighted average of 13.1%. Similarly, the statistical analysis conducted on geographies consisting of 91,805,923 people shows a poor positive correlation between the proportion of Osage and percentage of population currently divorced or separated in the United States with a correlation coefficient (R) of 0.198 and weighted average of 13.4%, a difference of 2.7%.
Divorced or Separated Correlation Summary
| Measurement | Immigrants from Cabo Verde | Osage |
| Minimum | 9.3% | 6.9% |
| Maximum | 17.1% | 22.0% |
| Range | 7.8% | 15.1% |
| Mean | 12.8% | 14.3% |
| Median | 13.1% | 14.3% |
| Interquartile 25% (IQ1) | 11.1% | 12.3% |
| Interquartile 75% (IQ3) | 14.2% | 16.5% |
| Interquartile Range (IQR) | 3.1% | 4.1% |
| Standard Deviation (Sample) | 2.0% | 3.5% |
| Standard Deviation (Population) | 1.9% | 3.5% |
Similar Demographics by Divorced or Separated
Demographics Similar to Immigrants from Cabo Verde by Divorced or Separated
In terms of divorced or separated, the demographic groups most similar to Immigrants from Cabo Verde are Alaskan Athabascan (13.1%, a difference of 0.21%), Immigrants from Venezuela (13.1%, a difference of 0.31%), Cape Verdean (13.1%, a difference of 0.33%), Hopi (13.2%, a difference of 0.46%), and Chippewa (13.2%, a difference of 0.51%).
| Demographics | Rating | Rank | Divorced or Separated |
| Jamaicans | 0.0 /100 | #293 | Tragic 12.9% |
| Apache | 0.0 /100 | #294 | Tragic 12.9% |
| Celtics | 0.0 /100 | #295 | Tragic 13.0% |
| Nicaraguans | 0.0 /100 | #296 | Tragic 13.0% |
| Natives/Alaskans | 0.0 /100 | #297 | Tragic 13.0% |
| Venezuelans | 0.0 /100 | #298 | Tragic 13.0% |
| Immigrants | Jamaica | 0.0 /100 | #299 | Tragic 13.0% |
| Immigrants | Cabo Verde | 0.0 /100 | #300 | Tragic 13.1% |
| Alaskan Athabascans | 0.0 /100 | #301 | Tragic 13.1% |
| Immigrants | Venezuela | 0.0 /100 | #302 | Tragic 13.1% |
| Cape Verdeans | 0.0 /100 | #303 | Tragic 13.1% |
| Hopi | 0.0 /100 | #304 | Tragic 13.2% |
| Chippewa | 0.0 /100 | #305 | Tragic 13.2% |
| Tlingit-Haida | 0.0 /100 | #306 | Tragic 13.2% |
| French American Indians | 0.0 /100 | #307 | Tragic 13.2% |
Demographics Similar to Osage by Divorced or Separated
In terms of divorced or separated, the demographic groups most similar to Osage are Potawatomi (13.5%, a difference of 0.060%), U.S. Virgin Islander (13.4%, a difference of 0.070%), Immigrants from Congo (13.5%, a difference of 0.070%), Immigrants from Haiti (13.4%, a difference of 0.29%), and Cheyenne (13.4%, a difference of 0.53%).
| Demographics | Rating | Rank | Divorced or Separated |
| Haitians | 0.0 /100 | #317 | Tragic 13.3% |
| Cree | 0.0 /100 | #318 | Tragic 13.4% |
| Puget Sound Salish | 0.0 /100 | #319 | Tragic 13.4% |
| Cajuns | 0.0 /100 | #320 | Tragic 13.4% |
| Cheyenne | 0.0 /100 | #321 | Tragic 13.4% |
| Immigrants | Haiti | 0.0 /100 | #322 | Tragic 13.4% |
| U.S. Virgin Islanders | 0.0 /100 | #323 | Tragic 13.4% |
| Osage | 0.0 /100 | #324 | Tragic 13.4% |
| Potawatomi | 0.0 /100 | #325 | Tragic 13.5% |
| Immigrants | Congo | 0.0 /100 | #326 | Tragic 13.5% |
| Comanche | 0.0 /100 | #327 | Tragic 13.5% |
| Immigrants | Caribbean | 0.0 /100 | #328 | Tragic 13.6% |
| Houma | 0.0 /100 | #329 | Tragic 13.6% |
| Paiute | 0.0 /100 | #330 | Tragic 13.6% |
| Blacks/African Americans | 0.0 /100 | #331 | Tragic 13.6% |