Immigrants from Cabo Verde vs Northern European Births to Unmarried Women
COMPARE
Immigrants from Cabo Verde
Northern European
Births to Unmarried Women
Births to Unmarried Women Comparison
Immigrants from Cabo Verde
Northern Europeans
42.2%
BIRTHS TO UNMARRIED WOMEN
0.0/ 100
METRIC RATING
328th/ 347
METRIC RANK
30.6%
BIRTHS TO UNMARRIED WOMEN
81.4/ 100
METRIC RATING
146th/ 347
METRIC RANK
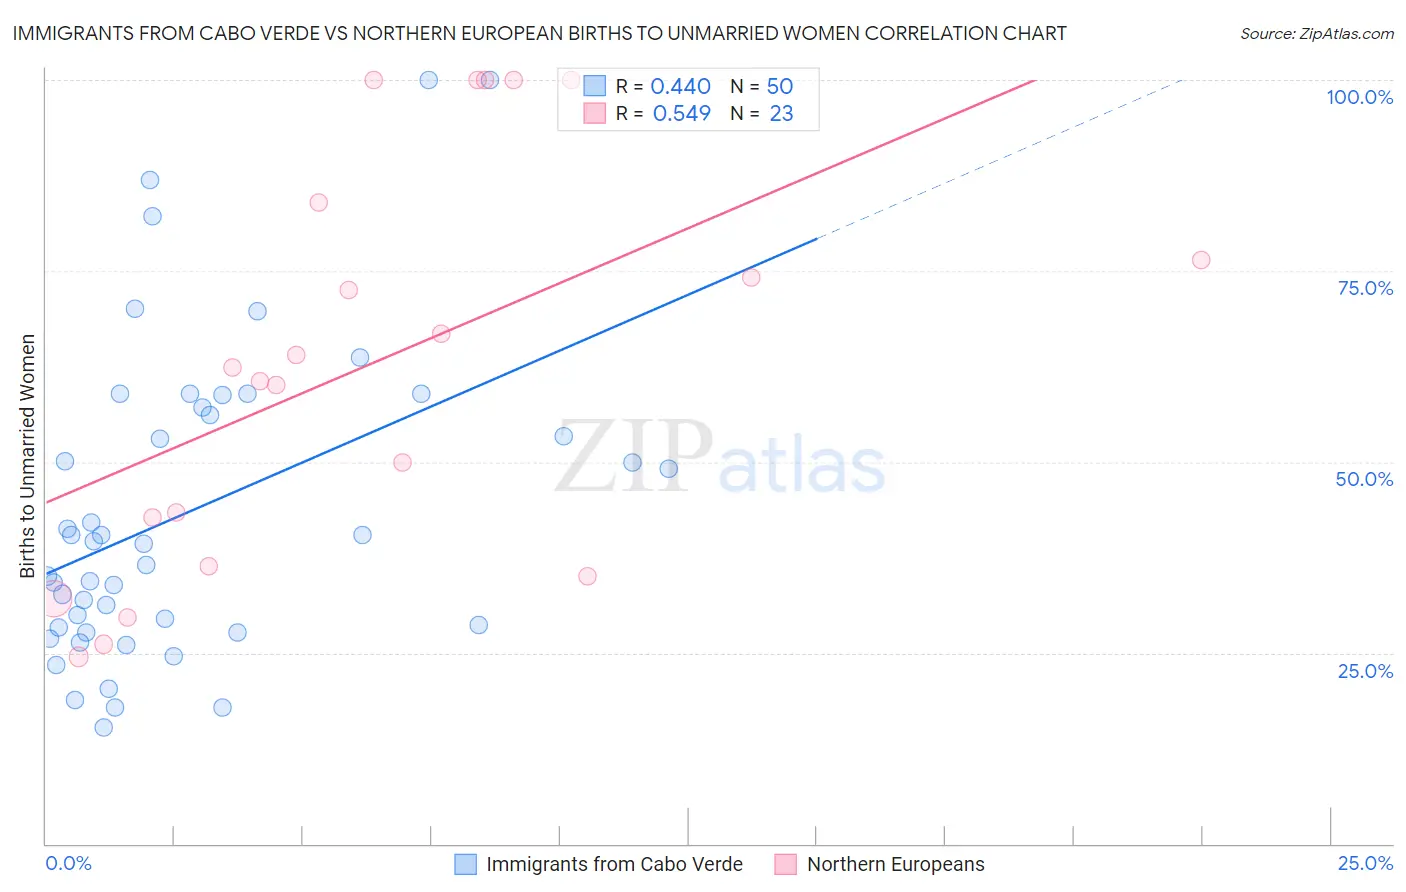
Immigrants from Cabo Verde vs Northern European Births to Unmarried Women Correlation Chart
The statistical analysis conducted on geographies consisting of 37,364,845 people shows a moderate positive correlation between the proportion of Immigrants from Cabo Verde and percentage of births to unmarried women in the United States with a correlation coefficient (R) of 0.440 and weighted average of 42.2%. Similarly, the statistical analysis conducted on geographies consisting of 374,226,135 people shows a substantial positive correlation between the proportion of Northern Europeans and percentage of births to unmarried women in the United States with a correlation coefficient (R) of 0.549 and weighted average of 30.6%, a difference of 38.1%.
Births to Unmarried Women Correlation Summary
| Measurement | Immigrants from Cabo Verde | Northern European |
| Minimum | 15.3% | 24.5% |
| Maximum | 100.0% | 100.0% |
| Range | 84.7% | 75.5% |
| Mean | 43.6% | 62.6% |
| Median | 39.4% | 62.3% |
| Interquartile 25% (IQ1) | 28.3% | 36.3% |
| Interquartile 75% (IQ3) | 57.2% | 83.9% |
| Interquartile Range (IQR) | 28.9% | 47.6% |
| Standard Deviation (Sample) | 20.5% | 26.2% |
| Standard Deviation (Population) | 20.2% | 25.6% |
Similar Demographics by Births to Unmarried Women
Demographics Similar to Immigrants from Cabo Verde by Births to Unmarried Women
In terms of births to unmarried women, the demographic groups most similar to Immigrants from Cabo Verde are Tsimshian (42.2%, a difference of 0.13%), Paiute (42.5%, a difference of 0.60%), Chippewa (42.6%, a difference of 1.0%), Immigrants from Cuba (41.5%, a difference of 1.8%), and Native/Alaskan (43.0%, a difference of 1.8%).
| Demographics | Rating | Rank | Births to Unmarried Women |
| Bahamians | 0.0 /100 | #321 | Tragic 40.8% |
| Cajuns | 0.0 /100 | #322 | Tragic 41.0% |
| Sioux | 0.0 /100 | #323 | Tragic 41.0% |
| Cape Verdeans | 0.0 /100 | #324 | Tragic 41.3% |
| Cheyenne | 0.0 /100 | #325 | Tragic 41.3% |
| Immigrants | Cuba | 0.0 /100 | #326 | Tragic 41.5% |
| Tsimshian | 0.0 /100 | #327 | Tragic 42.2% |
| Immigrants | Cabo Verde | 0.0 /100 | #328 | Tragic 42.2% |
| Paiute | 0.0 /100 | #329 | Tragic 42.5% |
| Chippewa | 0.0 /100 | #330 | Tragic 42.6% |
| Natives/Alaskans | 0.0 /100 | #331 | Tragic 43.0% |
| Kiowa | 0.0 /100 | #332 | Tragic 43.1% |
| Blacks/African Americans | 0.0 /100 | #333 | Tragic 44.3% |
| Yuman | 0.0 /100 | #334 | Tragic 44.4% |
| Colville | 0.0 /100 | #335 | Tragic 45.3% |
Demographics Similar to Northern Europeans by Births to Unmarried Women
In terms of births to unmarried women, the demographic groups most similar to Northern Europeans are Immigrants from North America (30.6%, a difference of 0.030%), Immigrants from Oceania (30.6%, a difference of 0.030%), Czech (30.5%, a difference of 0.13%), Immigrants from Uganda (30.5%, a difference of 0.20%), and South African (30.5%, a difference of 0.22%).
| Demographics | Rating | Rank | Births to Unmarried Women |
| Immigrants | Canada | 83.7 /100 | #139 | Excellent 30.4% |
| Swiss | 83.1 /100 | #140 | Excellent 30.5% |
| Pakistanis | 83.0 /100 | #141 | Excellent 30.5% |
| South Africans | 82.7 /100 | #142 | Excellent 30.5% |
| Immigrants | Uganda | 82.6 /100 | #143 | Excellent 30.5% |
| Czechs | 82.1 /100 | #144 | Excellent 30.5% |
| Immigrants | North America | 81.5 /100 | #145 | Excellent 30.6% |
| Northern Europeans | 81.4 /100 | #146 | Excellent 30.6% |
| Immigrants | Oceania | 81.2 /100 | #147 | Excellent 30.6% |
| Chileans | 79.1 /100 | #148 | Good 30.7% |
| Serbians | 78.8 /100 | #149 | Good 30.7% |
| Somalis | 77.8 /100 | #150 | Good 30.7% |
| Italians | 77.0 /100 | #151 | Good 30.8% |
| Poles | 76.2 /100 | #152 | Good 30.8% |
| British | 76.0 /100 | #153 | Good 30.8% |