Immigrants from Belgium vs West Indian Births to Unmarried Women
COMPARE
Immigrants from Belgium
West Indian
Births to Unmarried Women
Births to Unmarried Women Comparison
Immigrants from Belgium
West Indians
28.0%
BIRTHS TO UNMARRIED WOMEN
99.3/ 100
METRIC RATING
56th/ 347
METRIC RANK
37.3%
BIRTHS TO UNMARRIED WOMEN
0.1/ 100
METRIC RATING
279th/ 347
METRIC RANK
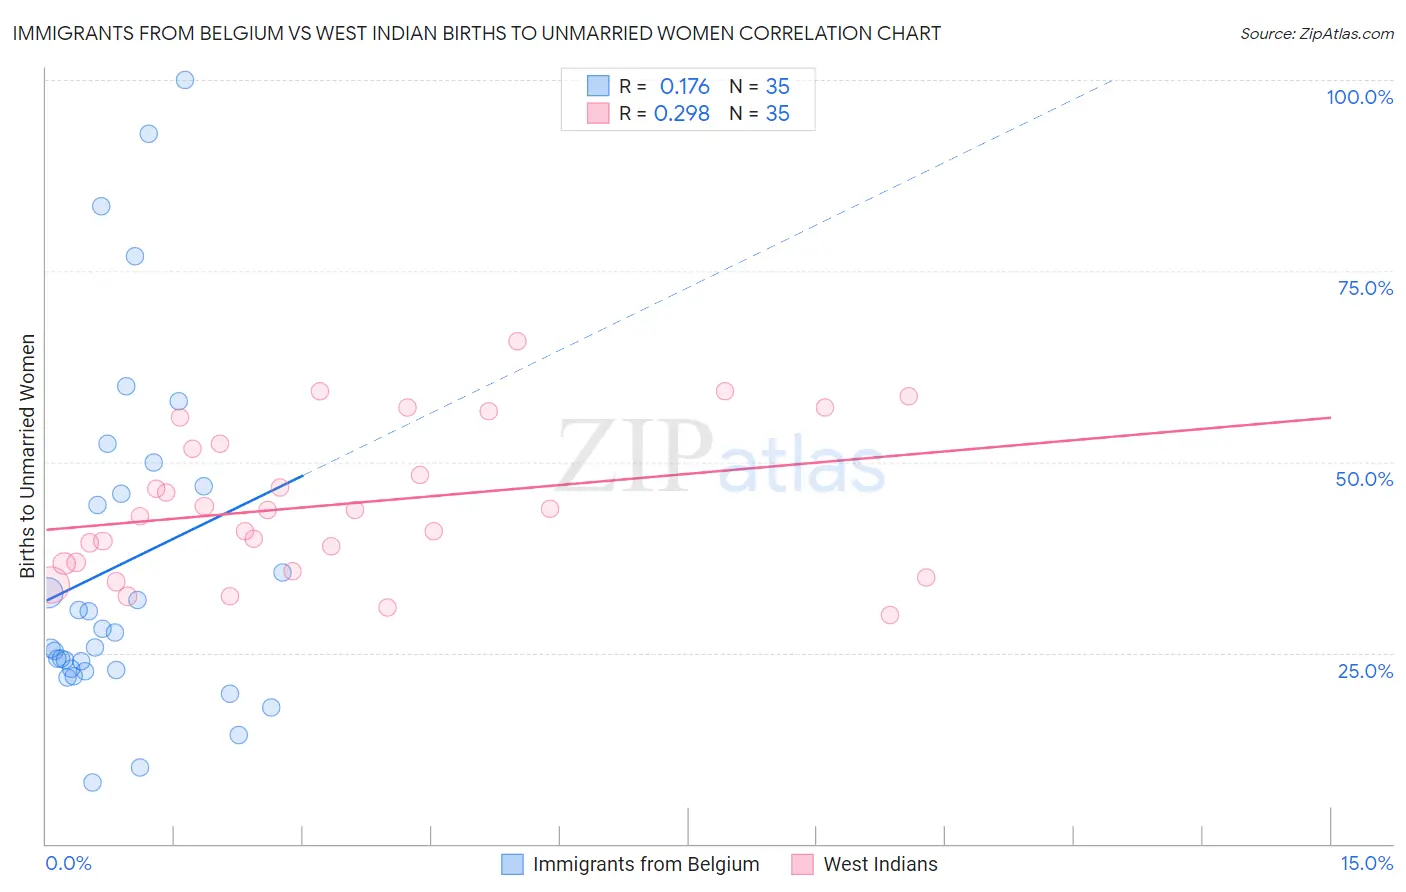
Immigrants from Belgium vs West Indian Births to Unmarried Women Correlation Chart
The statistical analysis conducted on geographies consisting of 139,482,659 people shows a poor positive correlation between the proportion of Immigrants from Belgium and percentage of births to unmarried women in the United States with a correlation coefficient (R) of 0.176 and weighted average of 28.0%. Similarly, the statistical analysis conducted on geographies consisting of 244,812,530 people shows a weak positive correlation between the proportion of West Indians and percentage of births to unmarried women in the United States with a correlation coefficient (R) of 0.298 and weighted average of 37.3%, a difference of 33.2%.
Births to Unmarried Women Correlation Summary
| Measurement | Immigrants from Belgium | West Indian |
| Minimum | 8.0% | 30.0% |
| Maximum | 100.0% | 65.8% |
| Range | 92.0% | 35.8% |
| Mean | 36.6% | 44.5% |
| Median | 27.6% | 43.7% |
| Interquartile 25% (IQ1) | 22.8% | 36.7% |
| Interquartile 75% (IQ3) | 46.8% | 52.4% |
| Interquartile Range (IQR) | 24.0% | 15.7% |
| Standard Deviation (Sample) | 22.8% | 9.6% |
| Standard Deviation (Population) | 22.4% | 9.5% |
Similar Demographics by Births to Unmarried Women
Demographics Similar to Immigrants from Belgium by Births to Unmarried Women
In terms of births to unmarried women, the demographic groups most similar to Immigrants from Belgium are Russian (28.0%, a difference of 0.13%), Immigrants from Albania (28.0%, a difference of 0.24%), Mongolian (27.9%, a difference of 0.26%), Afghan (27.9%, a difference of 0.30%), and Immigrants from Romania (27.9%, a difference of 0.37%).
| Demographics | Rating | Rank | Births to Unmarried Women |
| Immigrants | Greece | 99.4 /100 | #49 | Exceptional 27.8% |
| Maltese | 99.4 /100 | #50 | Exceptional 27.8% |
| Macedonians | 99.4 /100 | #51 | Exceptional 27.9% |
| Bhutanese | 99.4 /100 | #52 | Exceptional 27.9% |
| Immigrants | Romania | 99.4 /100 | #53 | Exceptional 27.9% |
| Afghans | 99.4 /100 | #54 | Exceptional 27.9% |
| Mongolians | 99.3 /100 | #55 | Exceptional 27.9% |
| Immigrants | Belgium | 99.3 /100 | #56 | Exceptional 28.0% |
| Russians | 99.2 /100 | #57 | Exceptional 28.0% |
| Immigrants | Albania | 99.2 /100 | #58 | Exceptional 28.0% |
| Immigrants | Kazakhstan | 99.1 /100 | #59 | Exceptional 28.1% |
| Immigrants | Turkey | 99.1 /100 | #60 | Exceptional 28.1% |
| Immigrants | North Macedonia | 99.1 /100 | #61 | Exceptional 28.1% |
| Egyptians | 99.0 /100 | #62 | Exceptional 28.2% |
| Immigrants | Serbia | 98.9 /100 | #63 | Exceptional 28.3% |
Demographics Similar to West Indians by Births to Unmarried Women
In terms of births to unmarried women, the demographic groups most similar to West Indians are Immigrants from St. Vincent and the Grenadines (37.3%, a difference of 0.12%), Immigrants from Belize (37.3%, a difference of 0.13%), Liberian (37.4%, a difference of 0.30%), Immigrants from Latin America (37.1%, a difference of 0.33%), and Spanish American Indian (37.4%, a difference of 0.38%).
| Demographics | Rating | Rank | Births to Unmarried Women |
| Choctaw | 0.1 /100 | #272 | Tragic 36.9% |
| Mexicans | 0.1 /100 | #273 | Tragic 36.9% |
| Cree | 0.1 /100 | #274 | Tragic 37.0% |
| Barbadians | 0.1 /100 | #275 | Tragic 37.0% |
| Belizeans | 0.1 /100 | #276 | Tragic 37.0% |
| Guatemalans | 0.1 /100 | #277 | Tragic 37.1% |
| Immigrants | Latin America | 0.1 /100 | #278 | Tragic 37.1% |
| West Indians | 0.1 /100 | #279 | Tragic 37.3% |
| Immigrants | St. Vincent and the Grenadines | 0.1 /100 | #280 | Tragic 37.3% |
| Immigrants | Belize | 0.1 /100 | #281 | Tragic 37.3% |
| Liberians | 0.0 /100 | #282 | Tragic 37.4% |
| Spanish American Indians | 0.0 /100 | #283 | Tragic 37.4% |
| Immigrants | Central America | 0.0 /100 | #284 | Tragic 37.4% |
| Immigrants | Mexico | 0.0 /100 | #285 | Tragic 37.5% |
| Immigrants | Guatemala | 0.0 /100 | #286 | Tragic 37.5% |