Immigrants from Asia vs Taiwanese Births to Unmarried Women
COMPARE
Immigrants from Asia
Taiwanese
Births to Unmarried Women
Births to Unmarried Women Comparison
Immigrants from Asia
Taiwanese
26.8%
BIRTHS TO UNMARRIED WOMEN
99.9/ 100
METRIC RATING
27th/ 347
METRIC RANK
29.0%
BIRTHS TO UNMARRIED WOMEN
97.3/ 100
METRIC RATING
87th/ 347
METRIC RANK
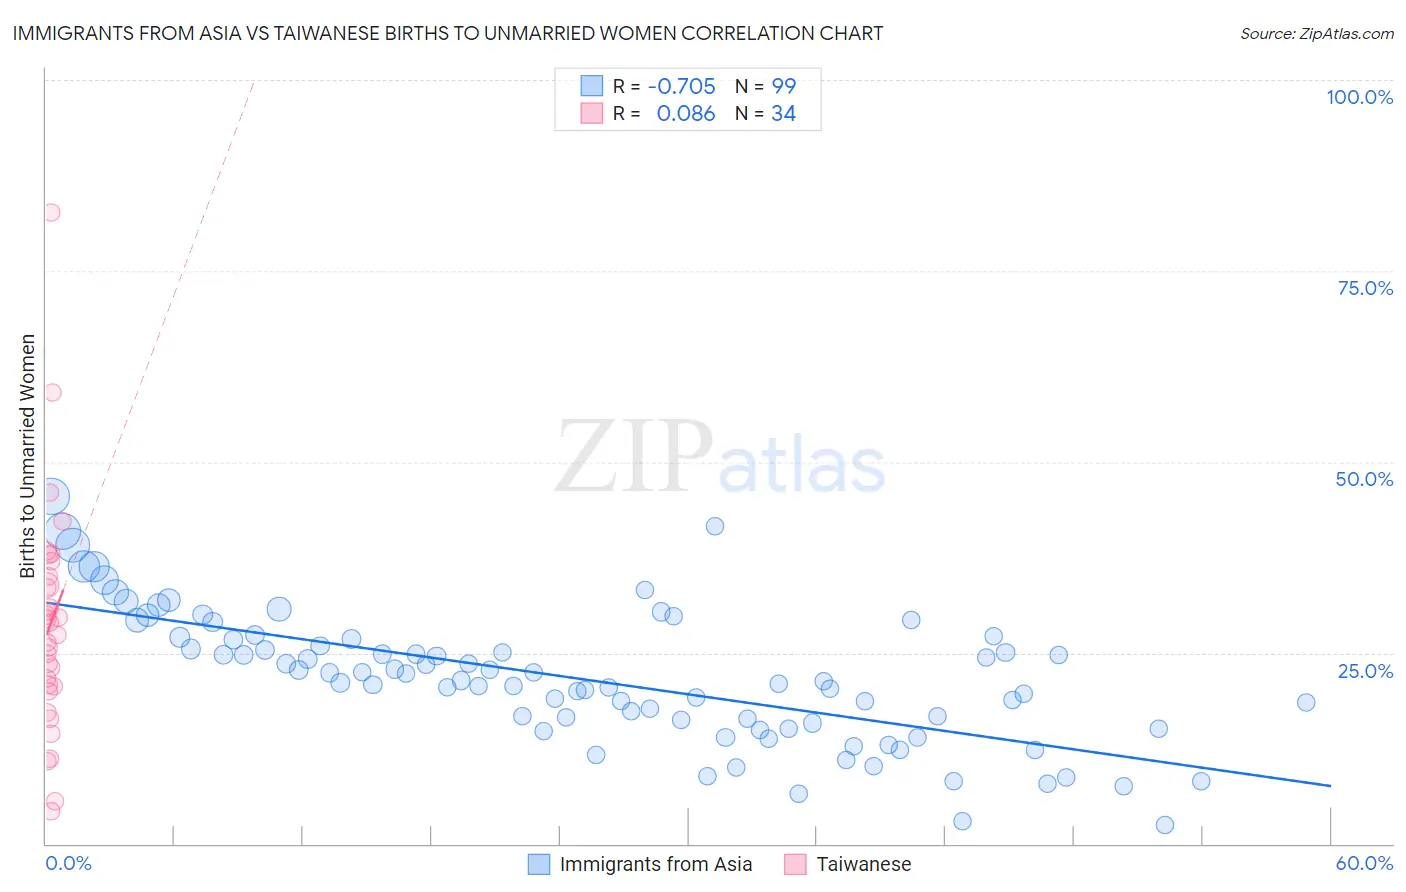
Immigrants from Asia vs Taiwanese Births to Unmarried Women Correlation Chart
The statistical analysis conducted on geographies consisting of 494,104,926 people shows a strong negative correlation between the proportion of Immigrants from Asia and percentage of births to unmarried women in the United States with a correlation coefficient (R) of -0.705 and weighted average of 26.8%. Similarly, the statistical analysis conducted on geographies consisting of 31,322,032 people shows a slight positive correlation between the proportion of Taiwanese and percentage of births to unmarried women in the United States with a correlation coefficient (R) of 0.086 and weighted average of 29.0%, a difference of 8.2%.
Births to Unmarried Women Correlation Summary
| Measurement | Immigrants from Asia | Taiwanese |
| Minimum | 2.4% | 4.2% |
| Maximum | 45.5% | 82.7% |
| Range | 43.1% | 78.5% |
| Mean | 21.5% | 28.7% |
| Median | 21.3% | 28.1% |
| Interquartile 25% (IQ1) | 15.8% | 20.6% |
| Interquartile 75% (IQ3) | 26.7% | 35.0% |
| Interquartile Range (IQR) | 10.9% | 14.4% |
| Standard Deviation (Sample) | 8.5% | 14.9% |
| Standard Deviation (Population) | 8.5% | 14.7% |
Similar Demographics by Births to Unmarried Women
Demographics Similar to Immigrants from Asia by Births to Unmarried Women
In terms of births to unmarried women, the demographic groups most similar to Immigrants from Asia are Asian (26.8%, a difference of 0.010%), Cambodian (26.7%, a difference of 0.40%), Okinawan (26.9%, a difference of 0.51%), Immigrants from Australia (26.6%, a difference of 0.62%), and Cypriot (27.0%, a difference of 0.87%).
| Demographics | Rating | Rank | Births to Unmarried Women |
| Immigrants | Korea | 99.9 /100 | #20 | Exceptional 26.3% |
| Soviet Union | 99.9 /100 | #21 | Exceptional 26.3% |
| Burmese | 99.9 /100 | #22 | Exceptional 26.4% |
| Immigrants | Japan | 99.9 /100 | #23 | Exceptional 26.4% |
| Immigrants | Australia | 99.9 /100 | #24 | Exceptional 26.6% |
| Cambodians | 99.9 /100 | #25 | Exceptional 26.7% |
| Asians | 99.9 /100 | #26 | Exceptional 26.8% |
| Immigrants | Asia | 99.9 /100 | #27 | Exceptional 26.8% |
| Okinawans | 99.8 /100 | #28 | Exceptional 26.9% |
| Cypriots | 99.8 /100 | #29 | Exceptional 27.0% |
| Bulgarians | 99.8 /100 | #30 | Exceptional 27.1% |
| Immigrants | Iraq | 99.8 /100 | #31 | Exceptional 27.1% |
| Immigrants | Russia | 99.8 /100 | #32 | Exceptional 27.1% |
| Immigrants | Sri Lanka | 99.8 /100 | #33 | Exceptional 27.2% |
| Immigrants | Pakistan | 99.8 /100 | #34 | Exceptional 27.2% |
Demographics Similar to Taiwanese by Births to Unmarried Women
In terms of births to unmarried women, the demographic groups most similar to Taiwanese are Immigrants from France (29.0%, a difference of 0.010%), Immigrants from Jordan (29.0%, a difference of 0.070%), Sri Lankan (28.9%, a difference of 0.15%), Immigrants from Saudi Arabia (29.1%, a difference of 0.28%), and Immigrants from Poland (28.9%, a difference of 0.32%).
| Demographics | Rating | Rank | Births to Unmarried Women |
| Immigrants | Afghanistan | 98.1 /100 | #80 | Exceptional 28.7% |
| Immigrants | Austria | 98.1 /100 | #81 | Exceptional 28.7% |
| Romanians | 98.0 /100 | #82 | Exceptional 28.7% |
| Immigrants | Kuwait | 98.0 /100 | #83 | Exceptional 28.8% |
| Immigrants | Poland | 97.6 /100 | #84 | Exceptional 28.9% |
| Sri Lankans | 97.5 /100 | #85 | Exceptional 28.9% |
| Immigrants | Jordan | 97.4 /100 | #86 | Exceptional 29.0% |
| Taiwanese | 97.3 /100 | #87 | Exceptional 29.0% |
| Immigrants | France | 97.3 /100 | #88 | Exceptional 29.0% |
| Immigrants | Saudi Arabia | 97.0 /100 | #89 | Exceptional 29.1% |
| Immigrants | Latvia | 96.8 /100 | #90 | Exceptional 29.1% |
| Immigrants | Fiji | 96.6 /100 | #91 | Exceptional 29.2% |
| Arabs | 96.5 /100 | #92 | Exceptional 29.2% |
| Estonians | 96.5 /100 | #93 | Exceptional 29.2% |
| Ukrainians | 96.3 /100 | #94 | Exceptional 29.2% |