Immigrants from Asia vs Immigrants from Guatemala Births to Unmarried Women

COMPARE

Immigrants from Asia
Race
Ancestry
AfghanAfricanAlaska NativeAlaskan AthabascanAlbanianAleutAlsatianAmericanApacheArabArapahoArgentineanArmenianAssyrian/Chaldean/SyriacAustralianAustrianBahamianBangladeshiBarbadianBasqueBelgianBelizeanBermudanBhutaneseBlackfeetBolivianBrazilianBritishBritish West IndianBulgarianBurmeseCajunCambodianCanadianCape VerdeanCarpatho RusynCelticCentral AmericanCentral American IndianCherokeeCheyenneChickasawChileanChineseChippewaChoctawColombianColvilleComancheCosta RicanCreeCreekCroatianCrowCubanCypriotCzechCzechoslovakianDanishDelawareDominicanDutchDutch West IndianEastern EuropeanEcuadorianEgyptianEnglishEstonianEthiopianEuropeanFijianFilipinoFinnishFrenchFrench American IndianFrench CanadianGermanGerman RussianGhanaianGreekGuamanian/ChamorroGuatemalanGuyaneseHaitianHmongHonduranHopiHoumaHungarianIcelanderIndian (Asian)IndonesianInupiatIranianIraqiIrishIroquoisIsraeliItalianJamaicanJapaneseJordanianKenyanKiowaKoreanLaotianLatvianLebaneseLiberianLithuanianLumbeeLuxembourgerMacedonianMalaysianMalteseMarshalleseMenomineeMexicanMexican American IndianMongolianMoroccanNative HawaiianNavajoNepaleseNew ZealanderNicaraguanNigerianNorthern EuropeanNorwegianOkinawanOsageOttawaPaiutePakistaniPalestinianPanamanianParaguayanPennsylvania GermanPeruvianPimaPolishPortuguesePotawatomiPuebloPuerto RicanPuget Sound SalishRomanianRussianSalvadoranSamoanScandinavianScotch-IrishScottishSeminoleSenegaleseSerbianShoshoneSierra LeoneanSiouxSlavicSlovakSloveneSomaliSouth AfricanSouth AmericanSouth American IndianSoviet UnionSpaniardSpanishSpanish AmericanSpanish American IndianSri LankanSubsaharan AfricanSudaneseSwedishSwissSyrianTaiwaneseThaiTlingit-HaidaTohono O'OdhamTonganTrinidadian and TobagonianTsimshianTurkishU.S. Virgin IslanderUgandanUkrainianUruguayanUteVenezuelanVietnameseWelshWest IndianYakamaYaquiYugoslavianYumanYup'ikZimbabwean
Immigration
NonimmigrantsImmigrantsAfghanistanAfricaAlbaniaArgentinaArmeniaAsiaAustraliaAustriaBahamasBangladeshBarbadosBelarusBelgiumBelizeBoliviaBosnia and HerzegovinaBrazilBulgariaBurma/MyanmarCabo VerdeCambodiaCameroonCanadaCaribbeanCentral AmericaChileChinaColombiaCongoCosta RicaCroatiaCubaCzechoslovakiaDenmarkDominicaDominican RepublicEastern AfricaEastern AsiaEastern EuropeEcuadorEgyptEl SalvadorEnglandEritreaEthiopiaEuropeFijiFranceGermanyGhanaGreeceGrenadaGuyanaHaitiHondurasHong KongHungaryIndiaIndonesiaIranIraqIrelandIsraelItalyJamaicaJapanJordanKazakhstanKenyaKoreaKuwaitLaosLatin AmericaLatviaLebanonLiberiaLithuaniaMalaysiaMexicoMicronesiaMiddle AfricaMoldovaMoroccoNepalNetherlandsNicaraguaNigeriaNorth AmericaNorth MacedoniaNorthern AfricaNorthern EuropeNorwayOceaniaPakistanPanamaPeruPhilippinesPolandPortugalRomaniaRussiaSaudi ArabiaScotlandSenegalSerbiaSierra LeoneSingaporeSomaliaSouth AfricaSouth AmericaSouth Central AsiaSouth Eastern AsiaSouthern EuropeSpainSri LankaSt. Vincent and the GrenadinesSudanSwedenSwitzerlandSyriaTaiwanThailandTrinidad and TobagoTurkeyUgandaUkraineUruguayUzbekistanVenezuelaVietnamWest IndiesWestern AfricaWestern AsiaWestern EuropeYemenZaireZimbabweAzores
Immigrants from Guatemala
Race
Ancestry
AfghanAfricanAlaska NativeAlaskan AthabascanAlbanianAleutAlsatianAmericanApacheArabArapahoArgentineanArmenianAssyrian/Chaldean/SyriacAustralianAustrianBahamianBangladeshiBarbadianBasqueBelgianBelizeanBermudanBhutaneseBlackfeetBolivianBrazilianBritishBritish West IndianBulgarianBurmeseCajunCambodianCanadianCape VerdeanCarpatho RusynCelticCentral AmericanCentral American IndianCherokeeCheyenneChickasawChileanChineseChippewaChoctawColombianColvilleComancheCosta RicanCreeCreekCroatianCrowCubanCypriotCzechCzechoslovakianDanishDelawareDominicanDutchDutch West IndianEastern EuropeanEcuadorianEgyptianEnglishEstonianEthiopianEuropeanFijianFilipinoFinnishFrenchFrench American IndianFrench CanadianGermanGerman RussianGhanaianGreekGuamanian/ChamorroGuatemalanGuyaneseHaitianHmongHonduranHopiHoumaHungarianIcelanderIndian (Asian)IndonesianInupiatIranianIraqiIrishIroquoisIsraeliItalianJamaicanJapaneseJordanianKenyanKiowaKoreanLaotianLatvianLebaneseLiberianLithuanianLumbeeLuxembourgerMacedonianMalaysianMalteseMarshalleseMenomineeMexicanMexican American IndianMongolianMoroccanNative HawaiianNavajoNepaleseNew ZealanderNicaraguanNigerianNorthern EuropeanNorwegianOkinawanOsageOttawaPaiutePakistaniPalestinianPanamanianParaguayanPennsylvania GermanPeruvianPimaPolishPortuguesePotawatomiPuebloPuerto RicanPuget Sound SalishRomanianRussianSalvadoranSamoanScandinavianScotch-IrishScottishSeminoleSenegaleseSerbianShoshoneSierra LeoneanSiouxSlavicSlovakSloveneSomaliSouth AfricanSouth AmericanSouth American IndianSoviet UnionSpaniardSpanishSpanish AmericanSpanish American IndianSri LankanSubsaharan AfricanSudaneseSwedishSwissSyrianTaiwaneseThaiTlingit-HaidaTohono O'OdhamTonganTrinidadian and TobagonianTsimshianTurkishU.S. Virgin IslanderUgandanUkrainianUruguayanUteVenezuelanVietnameseWelshWest IndianYakamaYaquiYugoslavianYumanYup'ikZimbabwean
Immigration
NonimmigrantsImmigrantsAfghanistanAfricaAlbaniaArgentinaArmeniaAustraliaAustriaBahamasBangladeshBarbadosBelarusBelgiumBelizeBoliviaBosnia and HerzegovinaBrazilBulgariaBurma/MyanmarCabo VerdeCambodiaCameroonCanadaCaribbeanCentral AmericaChileChinaColombiaCongoCosta RicaCroatiaCubaCzechoslovakiaDenmarkDominicaDominican RepublicEastern AfricaEastern AsiaEastern EuropeEcuadorEgyptEl SalvadorEnglandEritreaEthiopiaEuropeFijiFranceGermanyGhanaGreeceGrenadaGuatemalaGuyanaHaitiHondurasHong KongHungaryIndiaIndonesiaIranIraqIrelandIsraelItalyJamaicaJapanJordanKazakhstanKenyaKoreaKuwaitLaosLatin AmericaLatviaLebanonLiberiaLithuaniaMalaysiaMexicoMicronesiaMiddle AfricaMoldovaMoroccoNepalNetherlandsNicaraguaNigeriaNorth AmericaNorth MacedoniaNorthern AfricaNorthern EuropeNorwayOceaniaPakistanPanamaPeruPhilippinesPolandPortugalRomaniaRussiaSaudi ArabiaScotlandSenegalSerbiaSierra LeoneSingaporeSomaliaSouth AfricaSouth AmericaSouth Central AsiaSouth Eastern AsiaSouthern EuropeSpainSri LankaSt. Vincent and the GrenadinesSudanSwedenSwitzerlandSyriaTaiwanThailandTrinidad and TobagoTurkeyUgandaUkraineUruguayUzbekistanVenezuelaVietnamWest IndiesWestern AfricaWestern AsiaWestern EuropeYemenZaireZimbabweAzores
Births to Unmarried Women
Income
Poverty
Unemployment
Labor Participation
Family Structure
Vehicle Availability
Education Level
Disability

Births to Unmarried Women Comparison

Immigrants from Asia

Immigrants from Guatemala

Exceptional
Tragic
26.8%
BIRTHS TO UNMARRIED WOMEN
99.9/ 100
METRIC RATING
27th/ 347
METRIC RANK
37.5%
BIRTHS TO UNMARRIED WOMEN
0.0/ 100
METRIC RATING
286th/ 347
METRIC RANK

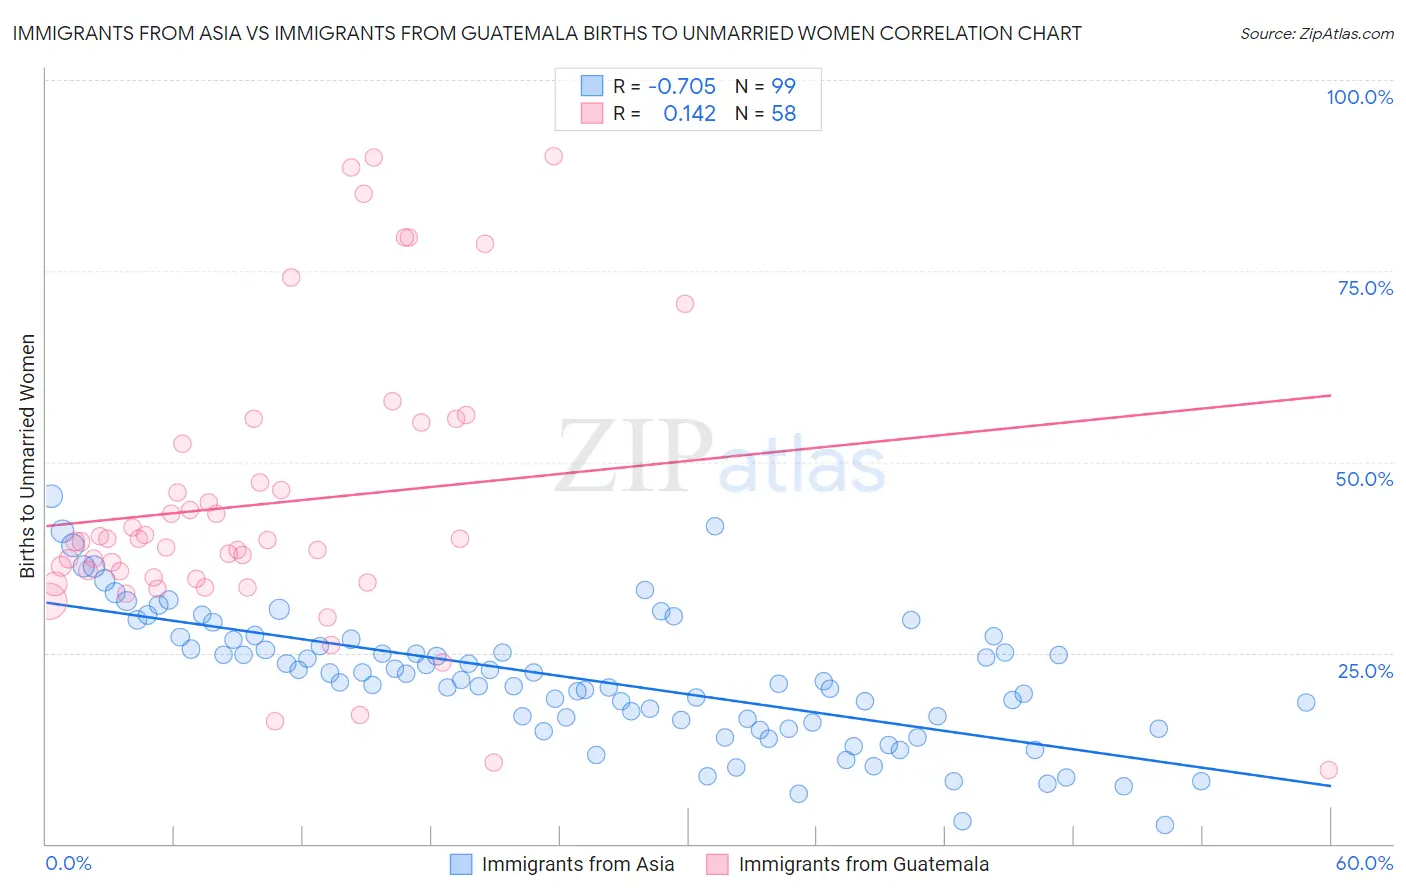
Immigrants from Asia vs Immigrants from Guatemala Births to Unmarried Women Correlation Chart

The statistical analysis conducted on geographies consisting of 494,104,926 people shows a strong negative correlation between the proportion of Immigrants from Asia and percentage of births to unmarried women in the United States with a correlation coefficient (R) of -0.705 and weighted average of 26.8%. Similarly, the statistical analysis conducted on geographies consisting of 358,367,687 people shows a poor positive correlation between the proportion of Immigrants from Guatemala and percentage of births to unmarried women in the United States with a correlation coefficient (R) of 0.142 and weighted average of 37.5%, a difference of 39.9%.
Immigrants from Asia vs Immigrants from Guatemala Births to Unmarried Women

Births to Unmarried Women Correlation Summary

MeasurementImmigrants from AsiaImmigrants from Guatemala
Minimum2.4%9.7%
Maximum45.5%90.0%
Range43.1%80.3%
Mean21.5%44.6%
Median21.3%39.6%
Interquartile 25% (IQ1)15.8%34.7%
Interquartile 75% (IQ3)26.7%52.4%
Interquartile Range (IQR)10.9%17.8%
Standard Deviation (Sample)8.5%18.9%
Standard Deviation (Population)8.5%18.7%

Similar Demographics by Births to Unmarried Women

Demographics Similar to Immigrants from Asia by Births to Unmarried Women

In terms of births to unmarried women, the demographic groups most similar to Immigrants from Asia are Asian (26.8%, a difference of 0.010%), Cambodian (26.7%, a difference of 0.40%), Okinawan (26.9%, a difference of 0.51%), Immigrants from Australia (26.6%, a difference of 0.62%), and Cypriot (27.0%, a difference of 0.87%).
DemographicsRating | RankBirths to Unmarried Women
Immigrants | Korea
99.9
/100
|
#20
Exceptional
26.3%
Soviet Union
99.9
/100
|
#21
Exceptional
26.3%
Burmese
99.9
/100
|
#22
Exceptional
26.4%
Immigrants | Japan
99.9
/100
|
#23
Exceptional
26.4%
Immigrants | Australia
99.9
/100
|
#24
Exceptional
26.6%
Cambodians
99.9
/100
|
#25
Exceptional
26.7%
Asians
99.9
/100
|
#26
Exceptional
26.8%
Immigrants | Asia
99.9
/100
|
#27
Exceptional
26.8%
Okinawans
99.8
/100
|
#28
Exceptional
26.9%
Cypriots
99.8
/100
|
#29
Exceptional
27.0%
Bulgarians
99.8
/100
|
#30
Exceptional
27.1%
Immigrants | Iraq
99.8
/100
|
#31
Exceptional
27.1%
Immigrants | Russia
99.8
/100
|
#32
Exceptional
27.1%
Immigrants | Sri Lanka
99.8
/100
|
#33
Exceptional
27.2%
Immigrants | Pakistan
99.8
/100
|
#34
Exceptional
27.2%

Demographics Similar to Immigrants from Guatemala by Births to Unmarried Women

In terms of births to unmarried women, the demographic groups most similar to Immigrants from Guatemala are Immigrants from Mexico (37.5%, a difference of 0.010%), Immigrants from Central America (37.4%, a difference of 0.11%), Spanish American Indian (37.4%, a difference of 0.18%), Creek (37.6%, a difference of 0.23%), and Liberian (37.4%, a difference of 0.26%).
DemographicsRating | RankBirths to Unmarried Women
West Indians
0.1
/100
|
#279
Tragic
37.3%
Immigrants | St. Vincent and the Grenadines
0.1
/100
|
#280
Tragic
37.3%
Immigrants | Belize
0.1
/100
|
#281
Tragic
37.3%
Liberians
0.0
/100
|
#282
Tragic
37.4%
Spanish American Indians
0.0
/100
|
#283
Tragic
37.4%
Immigrants | Central America
0.0
/100
|
#284
Tragic
37.4%
Immigrants | Mexico
0.0
/100
|
#285
Tragic
37.5%
Immigrants | Guatemala
0.0
/100
|
#286
Tragic
37.5%
Creek
0.0
/100
|
#287
Tragic
37.6%
Immigrants | Liberia
0.0
/100
|
#288
Tragic
37.6%
Alaskan Athabascans
0.0
/100
|
#289
Tragic
37.7%
Hispanics or Latinos
0.0
/100
|
#290
Tragic
37.8%
Seminole
0.0
/100
|
#291
Tragic
37.9%
Blackfeet
0.0
/100
|
#292
Tragic
37.9%
Immigrants | Nicaragua
0.0
/100
|
#293
Tragic
38.0%