European vs Ottawa Family Households
COMPARE
European
Ottawa
Family Households
Family Households Comparison
Europeans
Ottawa
65.0%
FAMILY HOUSEHOLDS
96.8/ 100
METRIC RATING
111th/ 347
METRIC RANK
63.0%
FAMILY HOUSEHOLDS
0.3/ 100
METRIC RATING
277th/ 347
METRIC RANK
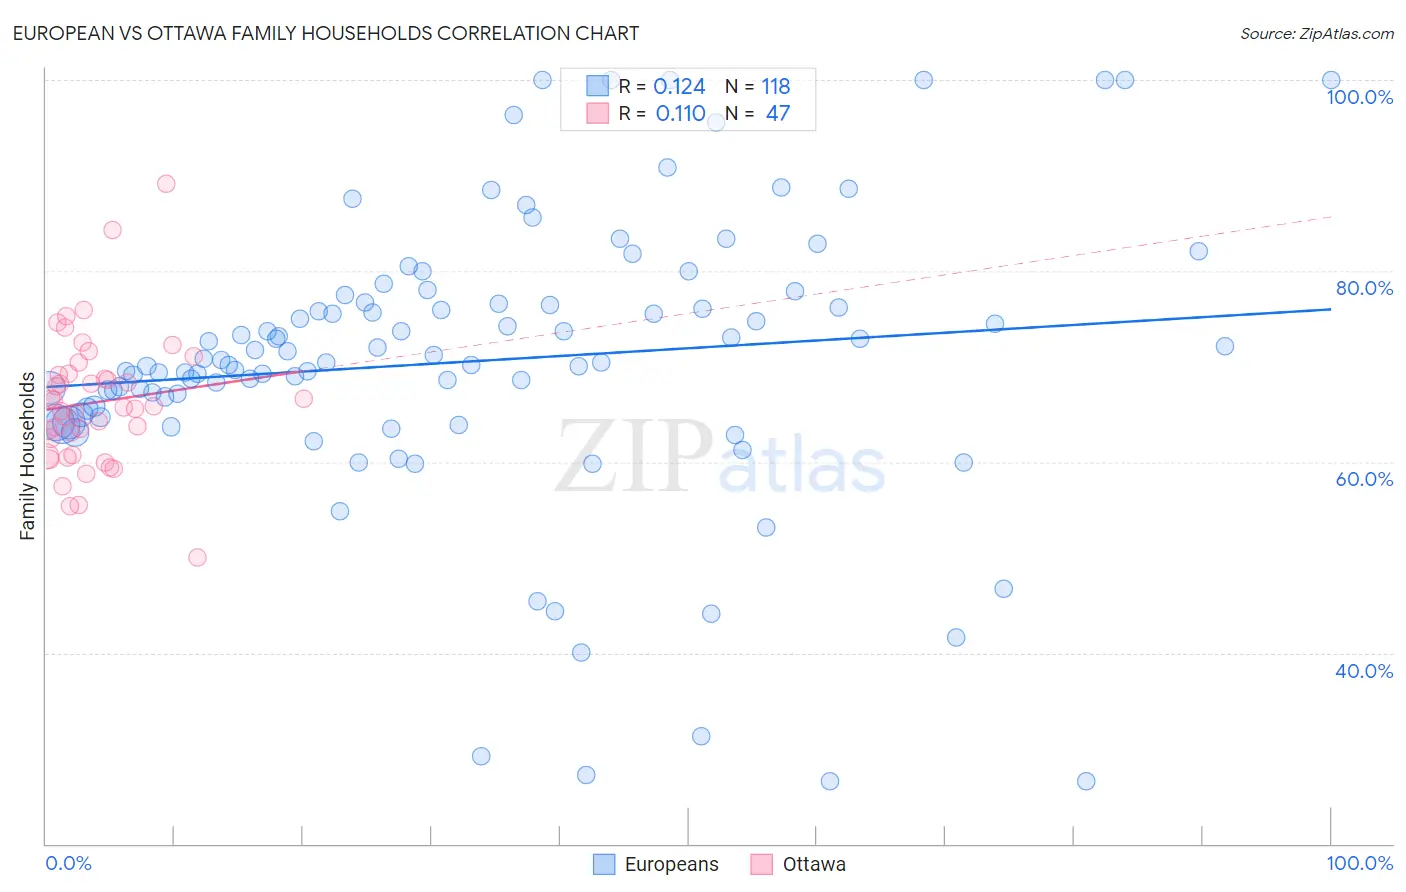
European vs Ottawa Family Households Correlation Chart
The statistical analysis conducted on geographies consisting of 561,245,057 people shows a poor positive correlation between the proportion of Europeans and percentage of family households in the United States with a correlation coefficient (R) of 0.124 and weighted average of 65.0%. Similarly, the statistical analysis conducted on geographies consisting of 49,944,420 people shows a poor positive correlation between the proportion of Ottawa and percentage of family households in the United States with a correlation coefficient (R) of 0.110 and weighted average of 63.0%, a difference of 3.2%.
Family Households Correlation Summary
| Measurement | European | Ottawa |
| Minimum | 26.5% | 50.0% |
| Maximum | 100.0% | 89.2% |
| Range | 73.5% | 39.2% |
| Mean | 70.5% | 66.2% |
| Median | 70.4% | 65.7% |
| Interquartile 25% (IQ1) | 65.0% | 60.7% |
| Interquartile 75% (IQ3) | 76.5% | 69.2% |
| Interquartile Range (IQR) | 11.6% | 8.6% |
| Standard Deviation (Sample) | 15.0% | 7.1% |
| Standard Deviation (Population) | 15.0% | 7.0% |
Similar Demographics by Family Households
Demographics Similar to Europeans by Family Households
In terms of family households, the demographic groups most similar to Europeans are Scandinavian (65.0%, a difference of 0.0%), Immigrants from Guatemala (65.0%, a difference of 0.010%), Immigrants from Jordan (65.0%, a difference of 0.030%), Palestinian (65.1%, a difference of 0.050%), and Alaska Native (65.1%, a difference of 0.060%).
| Demographics | Rating | Rank | Family Households |
| Spaniards | 97.8 /100 | #104 | Exceptional 65.1% |
| English | 97.4 /100 | #105 | Exceptional 65.1% |
| Whites/Caucasians | 97.3 /100 | #106 | Exceptional 65.1% |
| Alaska Natives | 97.3 /100 | #107 | Exceptional 65.1% |
| Palestinians | 97.2 /100 | #108 | Exceptional 65.1% |
| Immigrants | Guatemala | 96.9 /100 | #109 | Exceptional 65.0% |
| Scandinavians | 96.8 /100 | #110 | Exceptional 65.0% |
| Europeans | 96.8 /100 | #111 | Exceptional 65.0% |
| Immigrants | Jordan | 96.5 /100 | #112 | Exceptional 65.0% |
| Spanish | 96.2 /100 | #113 | Exceptional 65.0% |
| Argentineans | 95.7 /100 | #114 | Exceptional 65.0% |
| Ecuadorians | 95.4 /100 | #115 | Exceptional 65.0% |
| Immigrants | Iraq | 95.4 /100 | #116 | Exceptional 65.0% |
| Cherokee | 95.3 /100 | #117 | Exceptional 65.0% |
| Dutch | 95.1 /100 | #118 | Exceptional 64.9% |
Demographics Similar to Ottawa by Family Households
In terms of family households, the demographic groups most similar to Ottawa are Immigrants from Belgium (63.0%, a difference of 0.040%), Serbian (63.0%, a difference of 0.050%), Lumbee (63.1%, a difference of 0.070%), West Indian (63.1%, a difference of 0.070%), and Immigrants from Kazakhstan (63.1%, a difference of 0.080%).
| Demographics | Rating | Rank | Family Households |
| Immigrants | Austria | 0.3 /100 | #270 | Tragic 63.1% |
| Immigrants | Croatia | 0.3 /100 | #271 | Tragic 63.1% |
| Immigrants | Turkey | 0.3 /100 | #272 | Tragic 63.1% |
| Immigrants | Kazakhstan | 0.3 /100 | #273 | Tragic 63.1% |
| Lumbee | 0.3 /100 | #274 | Tragic 63.1% |
| West Indians | 0.3 /100 | #275 | Tragic 63.1% |
| Serbians | 0.3 /100 | #276 | Tragic 63.0% |
| Ottawa | 0.3 /100 | #277 | Tragic 63.0% |
| Immigrants | Belgium | 0.2 /100 | #278 | Tragic 63.0% |
| Immigrants | Yemen | 0.2 /100 | #279 | Tragic 63.0% |
| Immigrants | Bulgaria | 0.2 /100 | #280 | Tragic 63.0% |
| Estonians | 0.2 /100 | #281 | Tragic 62.9% |
| New Zealanders | 0.1 /100 | #282 | Tragic 62.9% |
| Immigrants | Denmark | 0.1 /100 | #283 | Tragic 62.9% |
| Australians | 0.1 /100 | #284 | Tragic 62.8% |