Estonian vs Portuguese Married-couple Households
COMPARE
Estonian
Portuguese
Married-couple Households
Married-couple Households Comparison
Estonians
Portuguese
47.7%
MARRIED-COUPLE HOUSEHOLDS
94.7/ 100
METRIC RATING
107th/ 347
METRIC RANK
47.8%
MARRIED-COUPLE HOUSEHOLDS
95.5/ 100
METRIC RATING
106th/ 347
METRIC RANK
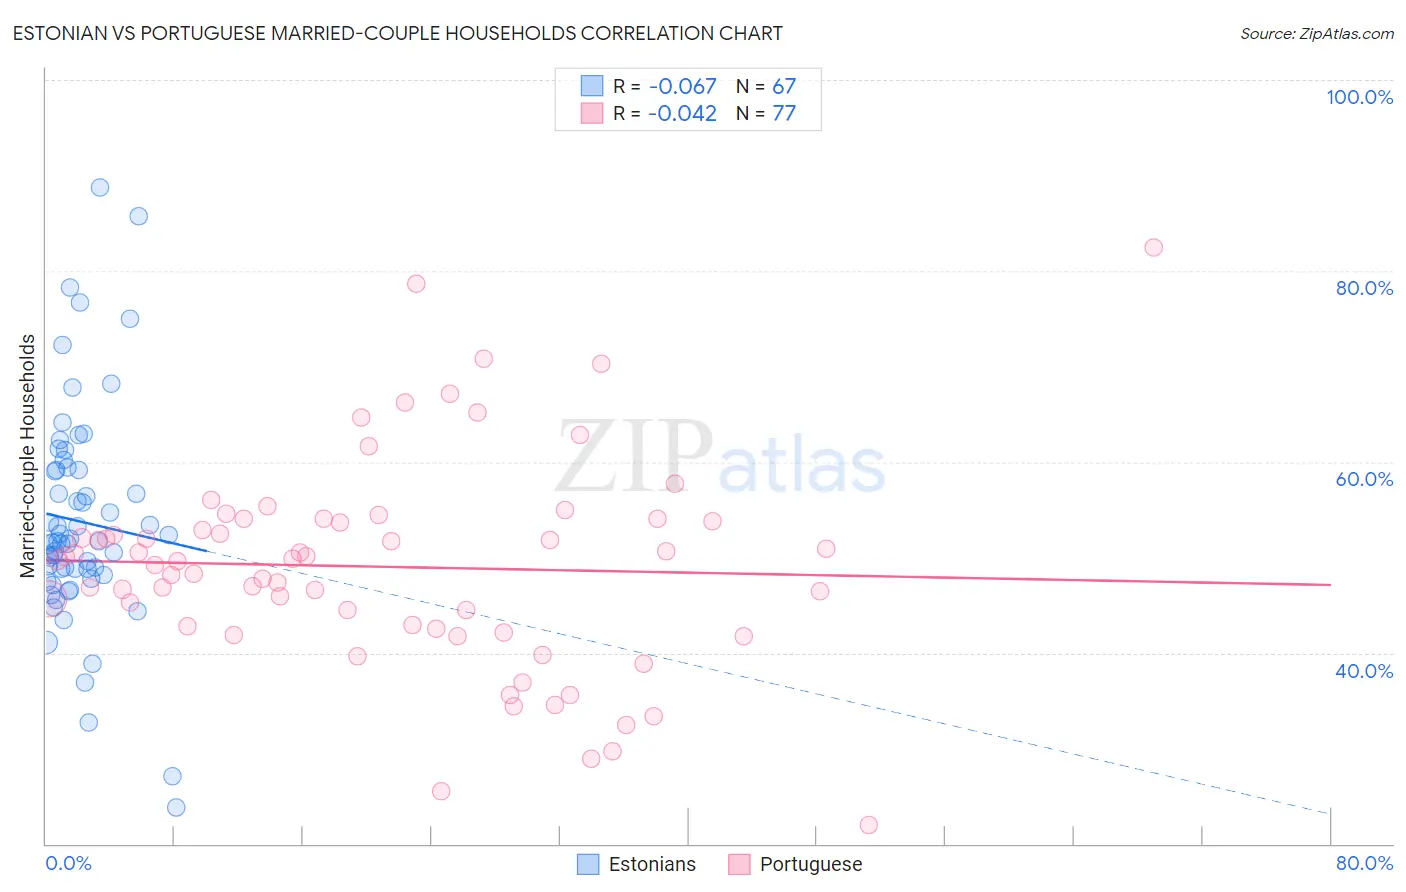
Estonian vs Portuguese Married-couple Households Correlation Chart
The statistical analysis conducted on geographies consisting of 123,500,387 people shows a slight negative correlation between the proportion of Estonians and percentage of married-couple family households in the United States with a correlation coefficient (R) of -0.067 and weighted average of 47.7%. Similarly, the statistical analysis conducted on geographies consisting of 449,970,895 people shows no correlation between the proportion of Portuguese and percentage of married-couple family households in the United States with a correlation coefficient (R) of -0.042 and weighted average of 47.8%, a difference of 0.16%.
Married-couple Households Correlation Summary
| Measurement | Estonian | Portuguese |
| Minimum | 23.8% | 21.9% |
| Maximum | 88.8% | 82.5% |
| Range | 65.0% | 60.6% |
| Mean | 53.8% | 49.0% |
| Median | 51.7% | 49.8% |
| Interquartile 25% (IQ1) | 48.1% | 42.6% |
| Interquartile 75% (IQ3) | 59.1% | 53.9% |
| Interquartile Range (IQR) | 11.0% | 11.3% |
| Standard Deviation (Sample) | 11.6% | 10.9% |
| Standard Deviation (Population) | 11.5% | 10.9% |
Demographics Similar to Estonians and Portuguese by Married-couple Households
In terms of married-couple households, the demographic groups most similar to Estonians are Immigrants from Japan (47.7%, a difference of 0.050%), Immigrants from Jordan (47.7%, a difference of 0.10%), Macedonian (47.6%, a difference of 0.12%), Syrian (47.6%, a difference of 0.13%), and Peruvian (47.6%, a difference of 0.14%). Similarly, the demographic groups most similar to Portuguese are Immigrants from Czechoslovakia (47.8%, a difference of 0.010%), Immigrants from South Africa (47.8%, a difference of 0.11%), Slavic (47.8%, a difference of 0.12%), Hawaiian (47.8%, a difference of 0.12%), and Turkish (47.8%, a difference of 0.14%).
| Demographics | Rating | Rank | Married-couple Households |
| Immigrants | Egypt | 96.6 /100 | #96 | Exceptional 47.9% |
| Latvians | 96.5 /100 | #97 | Exceptional 47.9% |
| Immigrants | North Macedonia | 96.4 /100 | #98 | Exceptional 47.9% |
| Immigrants | Austria | 96.4 /100 | #99 | Exceptional 47.9% |
| Immigrants | Italy | 96.3 /100 | #100 | Exceptional 47.9% |
| Turks | 96.1 /100 | #101 | Exceptional 47.8% |
| Slavs | 96.0 /100 | #102 | Exceptional 47.8% |
| Hawaiians | 96.0 /100 | #103 | Exceptional 47.8% |
| Immigrants | South Africa | 96.0 /100 | #104 | Exceptional 47.8% |
| Immigrants | Czechoslovakia | 95.5 /100 | #105 | Exceptional 47.8% |
| Portuguese | 95.5 /100 | #106 | Exceptional 47.8% |
| Estonians | 94.7 /100 | #107 | Exceptional 47.7% |
| Immigrants | Japan | 94.4 /100 | #108 | Exceptional 47.7% |
| Immigrants | Jordan | 94.1 /100 | #109 | Exceptional 47.7% |
| Macedonians | 93.9 /100 | #110 | Exceptional 47.6% |
| Syrians | 93.9 /100 | #111 | Exceptional 47.6% |
| Peruvians | 93.8 /100 | #112 | Exceptional 47.6% |
| Venezuelans | 93.8 /100 | #113 | Exceptional 47.6% |
| Immigrants | Europe | 93.7 /100 | #114 | Exceptional 47.6% |
| Slovaks | 92.9 /100 | #115 | Exceptional 47.6% |
| Argentineans | 92.5 /100 | #116 | Exceptional 47.5% |