Cheyenne vs Immigrants from Ukraine Family Households with Children
COMPARE
Cheyenne
Immigrants from Ukraine
Family Households with Children
Family Households with Children Comparison
Cheyenne
Immigrants from Ukraine
27.4%
FAMILY HOUSEHOLDS WITH CHILDREN
35.1/ 100
METRIC RATING
196th/ 347
METRIC RANK
27.2%
FAMILY HOUSEHOLDS WITH CHILDREN
14.4/ 100
METRIC RATING
210th/ 347
METRIC RANK
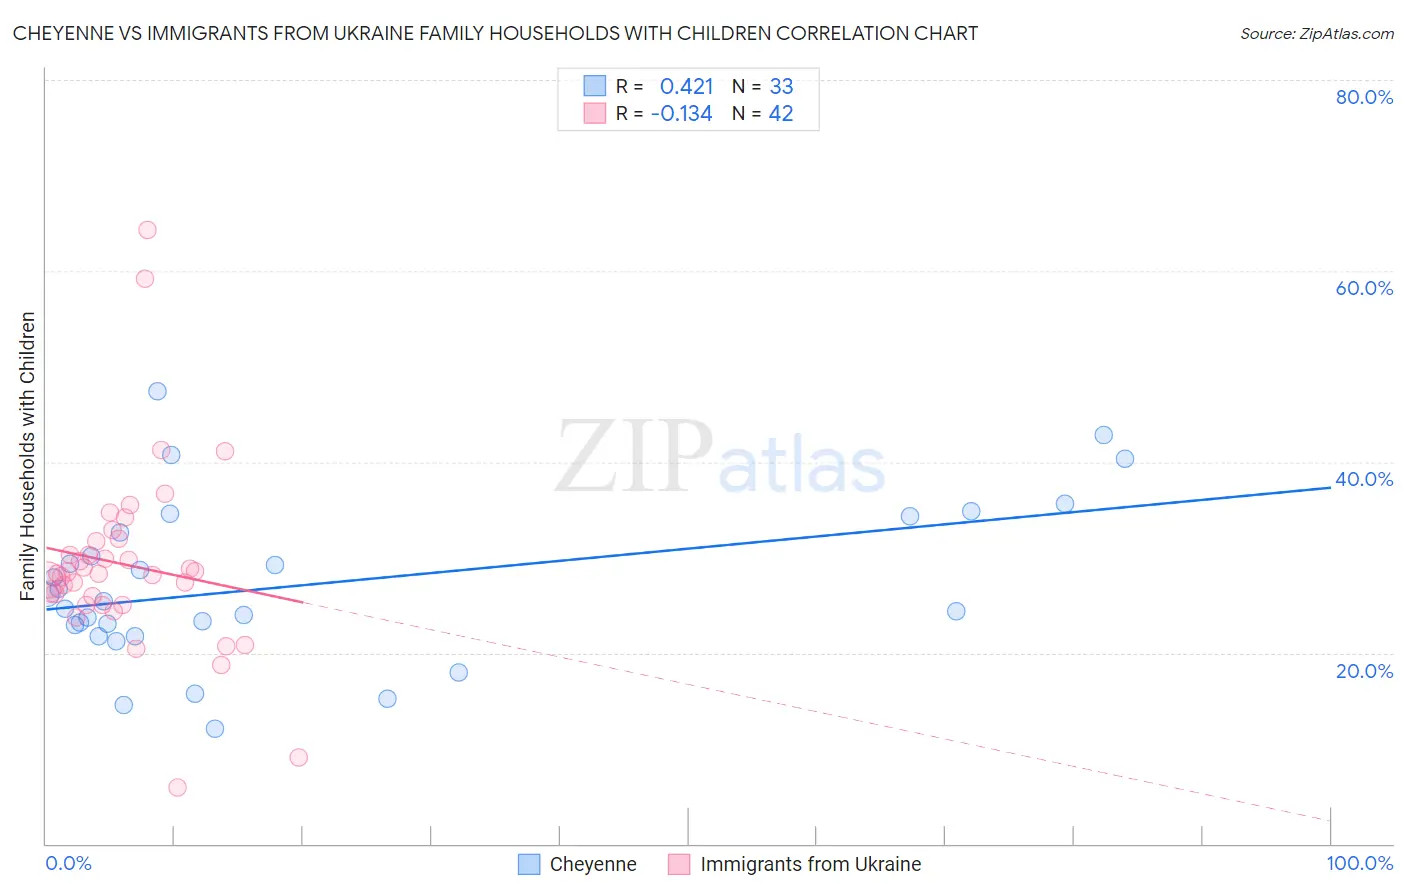
Cheyenne vs Immigrants from Ukraine Family Households with Children Correlation Chart
The statistical analysis conducted on geographies consisting of 80,669,159 people shows a moderate positive correlation between the proportion of Cheyenne and percentage of family households with children in the United States with a correlation coefficient (R) of 0.421 and weighted average of 27.4%. Similarly, the statistical analysis conducted on geographies consisting of 289,589,077 people shows a poor negative correlation between the proportion of Immigrants from Ukraine and percentage of family households with children in the United States with a correlation coefficient (R) of -0.134 and weighted average of 27.2%, a difference of 0.65%.
Family Households with Children Correlation Summary
| Measurement | Cheyenne | Immigrants from Ukraine |
| Minimum | 12.0% | 5.9% |
| Maximum | 47.4% | 64.3% |
| Range | 35.3% | 58.4% |
| Mean | 27.1% | 29.2% |
| Median | 25.4% | 28.3% |
| Interquartile 25% (IQ1) | 22.4% | 25.0% |
| Interquartile 75% (IQ3) | 33.4% | 31.7% |
| Interquartile Range (IQR) | 11.1% | 6.7% |
| Standard Deviation (Sample) | 8.4% | 9.9% |
| Standard Deviation (Population) | 8.2% | 9.8% |
Demographics Similar to Cheyenne and Immigrants from Ukraine by Family Households with Children
In terms of family households with children, the demographic groups most similar to Cheyenne are Norwegian (27.4%, a difference of 0.0%), Immigrants from Iran (27.4%, a difference of 0.020%), Crow (27.4%, a difference of 0.020%), Immigrants from Romania (27.4%, a difference of 0.020%), and Swedish (27.4%, a difference of 0.040%). Similarly, the demographic groups most similar to Immigrants from Ukraine are Welsh (27.2%, a difference of 0.010%), Immigrants from Dominica (27.2%, a difference of 0.020%), Okinawan (27.2%, a difference of 0.030%), Dutch West Indian (27.2%, a difference of 0.060%), and Immigrants from Poland (27.2%, a difference of 0.090%).
| Demographics | Rating | Rank | Family Households with Children |
| Swedes | 36.9 /100 | #193 | Fair 27.4% |
| Immigrants | Iran | 36.1 /100 | #194 | Fair 27.4% |
| Crow | 35.7 /100 | #195 | Fair 27.4% |
| Cheyenne | 35.1 /100 | #196 | Fair 27.4% |
| Norwegians | 35.0 /100 | #197 | Fair 27.4% |
| Immigrants | Romania | 34.4 /100 | #198 | Fair 27.4% |
| English | 32.0 /100 | #199 | Fair 27.3% |
| Immigrants | Congo | 28.7 /100 | #200 | Fair 27.3% |
| Bhutanese | 25.1 /100 | #201 | Fair 27.3% |
| Americans | 22.8 /100 | #202 | Fair 27.3% |
| Kiowa | 22.2 /100 | #203 | Fair 27.3% |
| Immigrants | Sudan | 21.6 /100 | #204 | Fair 27.3% |
| Immigrants | Haiti | 20.3 /100 | #205 | Fair 27.2% |
| Immigrants | Micronesia | 20.2 /100 | #206 | Fair 27.2% |
| Haitians | 19.8 /100 | #207 | Poor 27.2% |
| Immigrants | Poland | 16.4 /100 | #208 | Poor 27.2% |
| Dutch West Indians | 15.8 /100 | #209 | Poor 27.2% |
| Immigrants | Ukraine | 14.4 /100 | #210 | Poor 27.2% |
| Welsh | 14.2 /100 | #211 | Poor 27.2% |
| Immigrants | Dominica | 13.9 /100 | #212 | Poor 27.2% |
| Okinawans | 13.7 /100 | #213 | Poor 27.2% |