Bulgarian vs Immigrants from Ukraine Family Households with Children
COMPARE
Bulgarian
Immigrants from Ukraine
Family Households with Children
Family Households with Children Comparison
Bulgarians
Immigrants from Ukraine
27.0%
FAMILY HOUSEHOLDS WITH CHILDREN
5.8/ 100
METRIC RATING
230th/ 347
METRIC RANK
27.2%
FAMILY HOUSEHOLDS WITH CHILDREN
14.4/ 100
METRIC RATING
210th/ 347
METRIC RANK
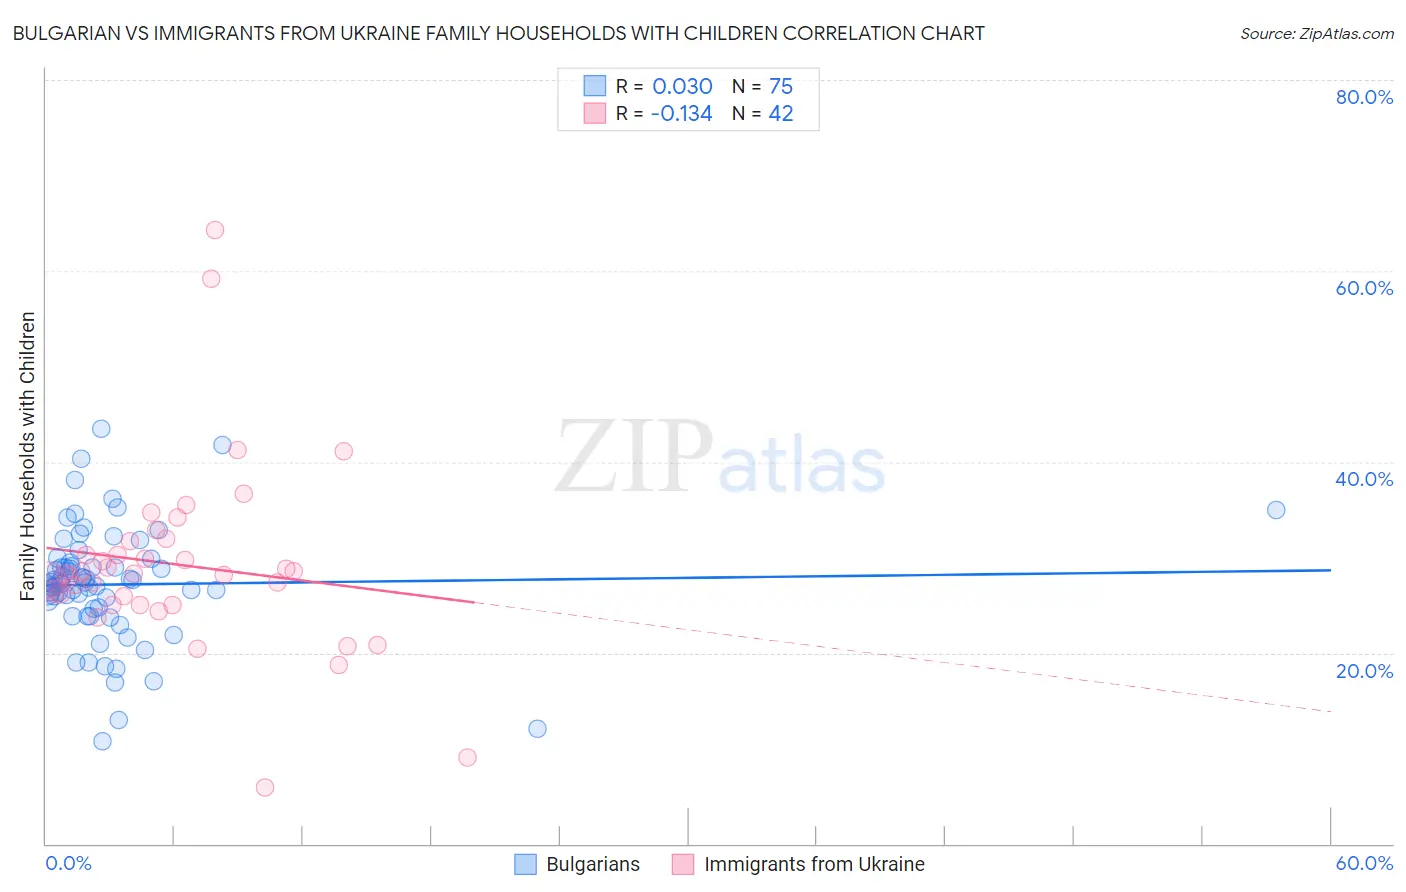
Bulgarian vs Immigrants from Ukraine Family Households with Children Correlation Chart
The statistical analysis conducted on geographies consisting of 205,477,079 people shows no correlation between the proportion of Bulgarians and percentage of family households with children in the United States with a correlation coefficient (R) of 0.030 and weighted average of 27.0%. Similarly, the statistical analysis conducted on geographies consisting of 289,589,077 people shows a poor negative correlation between the proportion of Immigrants from Ukraine and percentage of family households with children in the United States with a correlation coefficient (R) of -0.134 and weighted average of 27.2%, a difference of 0.57%.
Family Households with Children Correlation Summary
| Measurement | Bulgarian | Immigrants from Ukraine |
| Minimum | 10.8% | 5.9% |
| Maximum | 43.4% | 64.3% |
| Range | 32.7% | 58.4% |
| Mean | 27.2% | 29.2% |
| Median | 27.3% | 28.3% |
| Interquartile 25% (IQ1) | 24.6% | 25.0% |
| Interquartile 75% (IQ3) | 29.5% | 31.7% |
| Interquartile Range (IQR) | 4.9% | 6.7% |
| Standard Deviation (Sample) | 6.1% | 9.9% |
| Standard Deviation (Population) | 6.0% | 9.8% |
Demographics Similar to Bulgarians and Immigrants from Ukraine by Family Households with Children
In terms of family households with children, the demographic groups most similar to Bulgarians are Immigrants from Caribbean (27.0%, a difference of 0.050%), Czechoslovakian (27.0%, a difference of 0.080%), Tsimshian (27.0%, a difference of 0.080%), Scottish (27.0%, a difference of 0.080%), and Canadian (27.1%, a difference of 0.16%). Similarly, the demographic groups most similar to Immigrants from Ukraine are Welsh (27.2%, a difference of 0.010%), Immigrants from Dominica (27.2%, a difference of 0.020%), Okinawan (27.2%, a difference of 0.030%), African (27.2%, a difference of 0.070%), and Northern European (27.2%, a difference of 0.070%).
| Demographics | Rating | Rank | Family Households with Children |
| Immigrants | Ukraine | 14.4 /100 | #210 | Poor 27.2% |
| Welsh | 14.2 /100 | #211 | Poor 27.2% |
| Immigrants | Dominica | 13.9 /100 | #212 | Poor 27.2% |
| Okinawans | 13.7 /100 | #213 | Poor 27.2% |
| Africans | 13.0 /100 | #214 | Poor 27.2% |
| Northern Europeans | 12.8 /100 | #215 | Poor 27.2% |
| Cubans | 12.2 /100 | #216 | Poor 27.1% |
| U.S. Virgin Islanders | 12.1 /100 | #217 | Poor 27.1% |
| Greeks | 11.4 /100 | #218 | Poor 27.1% |
| Immigrants | Japan | 10.7 /100 | #219 | Poor 27.1% |
| Austrians | 9.9 /100 | #220 | Tragic 27.1% |
| New Zealanders | 9.6 /100 | #221 | Tragic 27.1% |
| Paraguayans | 9.4 /100 | #222 | Tragic 27.1% |
| Pima | 9.2 /100 | #223 | Tragic 27.1% |
| Germans | 8.7 /100 | #224 | Tragic 27.1% |
| Canadians | 7.5 /100 | #225 | Tragic 27.1% |
| Czechoslovakians | 6.6 /100 | #226 | Tragic 27.0% |
| Tsimshian | 6.6 /100 | #227 | Tragic 27.0% |
| Scottish | 6.5 /100 | #228 | Tragic 27.0% |
| Immigrants | Caribbean | 6.3 /100 | #229 | Tragic 27.0% |
| Bulgarians | 5.8 /100 | #230 | Tragic 27.0% |