Central American vs Seminole Family Households
COMPARE
Central American
Seminole
Family Households
Family Households Comparison
Central Americans
Seminole
66.0%
FAMILY HOUSEHOLDS
100.0/ 100
METRIC RATING
62nd/ 347
METRIC RANK
64.0%
FAMILY HOUSEHOLDS
18.9/ 100
METRIC RATING
197th/ 347
METRIC RANK
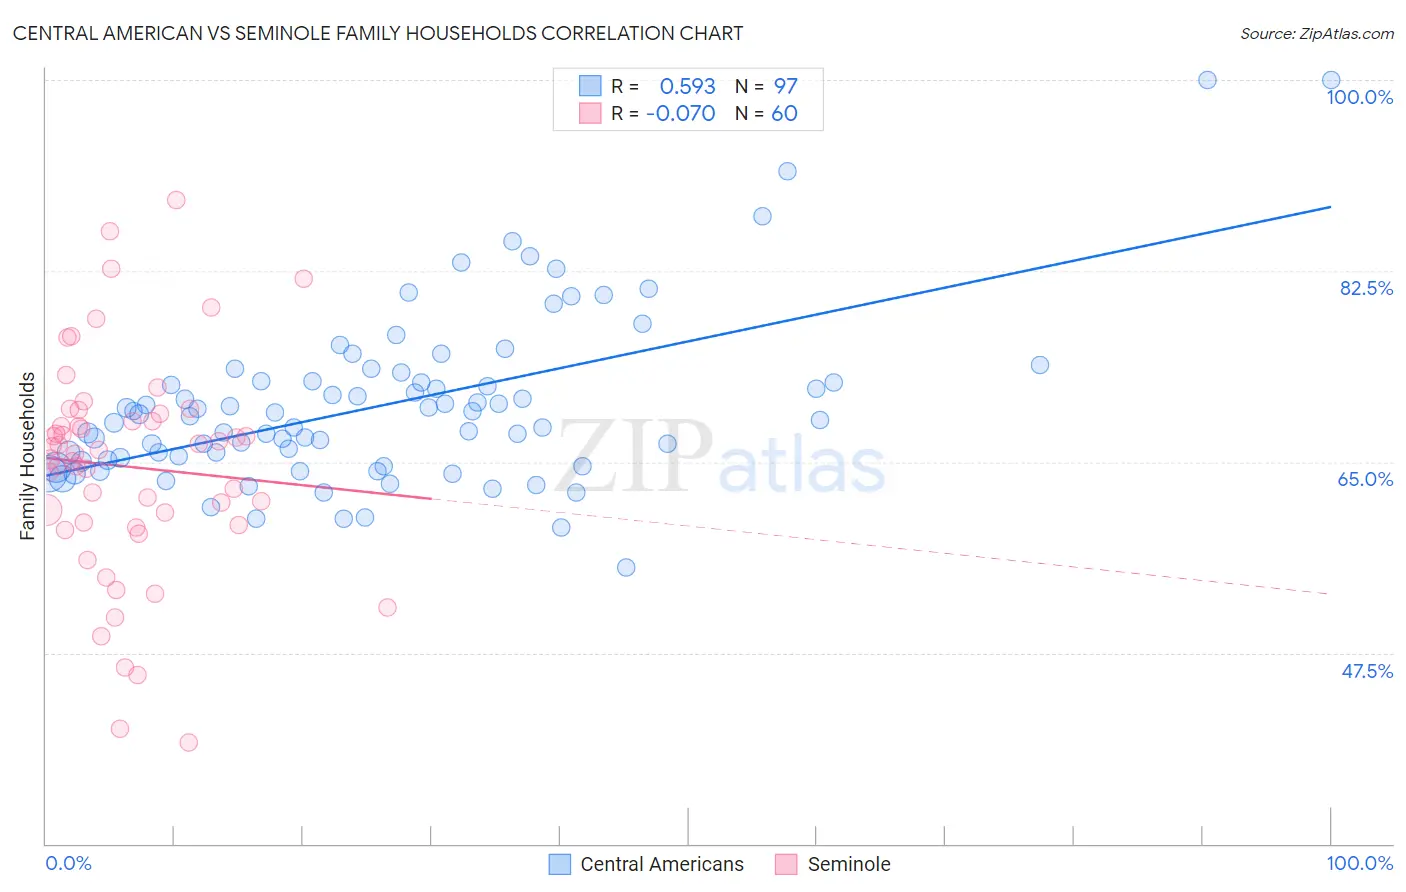
Central American vs Seminole Family Households Correlation Chart
The statistical analysis conducted on geographies consisting of 504,084,166 people shows a substantial positive correlation between the proportion of Central Americans and percentage of family households in the United States with a correlation coefficient (R) of 0.593 and weighted average of 66.0%. Similarly, the statistical analysis conducted on geographies consisting of 118,298,678 people shows a slight negative correlation between the proportion of Seminole and percentage of family households in the United States with a correlation coefficient (R) of -0.070 and weighted average of 64.0%, a difference of 3.2%.
Family Households Correlation Summary
| Measurement | Central American | Seminole |
| Minimum | 55.3% | 39.3% |
| Maximum | 100.0% | 89.0% |
| Range | 44.7% | 49.7% |
| Mean | 70.2% | 64.6% |
| Median | 69.2% | 65.9% |
| Interquartile 25% (IQ1) | 65.1% | 59.4% |
| Interquartile 75% (IQ3) | 72.4% | 69.1% |
| Interquartile Range (IQR) | 7.3% | 9.7% |
| Standard Deviation (Sample) | 7.8% | 10.1% |
| Standard Deviation (Population) | 7.8% | 10.0% |
Similar Demographics by Family Households
Demographics Similar to Central Americans by Family Households
In terms of family households, the demographic groups most similar to Central Americans are Danish (66.0%, a difference of 0.030%), Immigrants from Indonesia (66.0%, a difference of 0.040%), South American (66.0%, a difference of 0.050%), Immigrants from Korea (66.0%, a difference of 0.060%), and Immigrants from Asia (66.1%, a difference of 0.080%).
| Demographics | Rating | Rank | Family Households |
| Immigrants | Immigrants | 100.0 /100 | #55 | Exceptional 66.1% |
| Immigrants | Hong Kong | 100.0 /100 | #56 | Exceptional 66.1% |
| Pennsylvania Germans | 100.0 /100 | #57 | Exceptional 66.1% |
| Immigrants | Asia | 100.0 /100 | #58 | Exceptional 66.1% |
| Immigrants | Korea | 100.0 /100 | #59 | Exceptional 66.0% |
| South Americans | 100.0 /100 | #60 | Exceptional 66.0% |
| Danes | 100.0 /100 | #61 | Exceptional 66.0% |
| Central Americans | 100.0 /100 | #62 | Exceptional 66.0% |
| Immigrants | Indonesia | 100.0 /100 | #63 | Exceptional 66.0% |
| Pima | 99.9 /100 | #64 | Exceptional 65.9% |
| Costa Ricans | 99.9 /100 | #65 | Exceptional 65.9% |
| Fijians | 99.9 /100 | #66 | Exceptional 65.9% |
| Filipinos | 99.9 /100 | #67 | Exceptional 65.9% |
| Japanese | 99.9 /100 | #68 | Exceptional 65.9% |
| Malaysians | 99.9 /100 | #69 | Exceptional 65.9% |
Demographics Similar to Seminole by Family Households
In terms of family households, the demographic groups most similar to Seminole are Polish (64.0%, a difference of 0.0%), Immigrants from Canada (64.0%, a difference of 0.010%), Slavic (64.0%, a difference of 0.010%), Immigrants from North America (64.0%, a difference of 0.020%), and Immigrants from Malaysia (64.0%, a difference of 0.020%).
| Demographics | Rating | Rank | Family Households |
| Zimbabweans | 24.7 /100 | #190 | Fair 64.1% |
| Arabs | 24.5 /100 | #191 | Fair 64.1% |
| Lithuanians | 23.8 /100 | #192 | Fair 64.0% |
| French | 23.7 /100 | #193 | Fair 64.0% |
| Paiute | 22.2 /100 | #194 | Fair 64.0% |
| Immigrants | North America | 20.0 /100 | #195 | Poor 64.0% |
| Immigrants | Canada | 19.2 /100 | #196 | Poor 64.0% |
| Seminole | 18.9 /100 | #197 | Poor 64.0% |
| Poles | 18.9 /100 | #198 | Poor 64.0% |
| Slavs | 18.6 /100 | #199 | Poor 64.0% |
| Immigrants | Malaysia | 17.9 /100 | #200 | Poor 64.0% |
| Immigrants | Eastern Europe | 17.2 /100 | #201 | Poor 64.0% |
| Iranians | 13.5 /100 | #202 | Poor 63.9% |
| Norwegians | 13.2 /100 | #203 | Poor 63.9% |
| Immigrants | Uruguay | 12.8 /100 | #204 | Poor 63.9% |