Zimbabwean vs Belgian GED/Equivalency
COMPARE
Zimbabwean
Belgian
GED/Equivalency
GED/Equivalency Comparison
Zimbabweans
Belgians
88.0%
GED/EQUIVALENCY
99.4/ 100
METRIC RATING
52nd/ 347
METRIC RANK
87.7%
GED/EQUIVALENCY
98.8/ 100
METRIC RATING
73rd/ 347
METRIC RANK
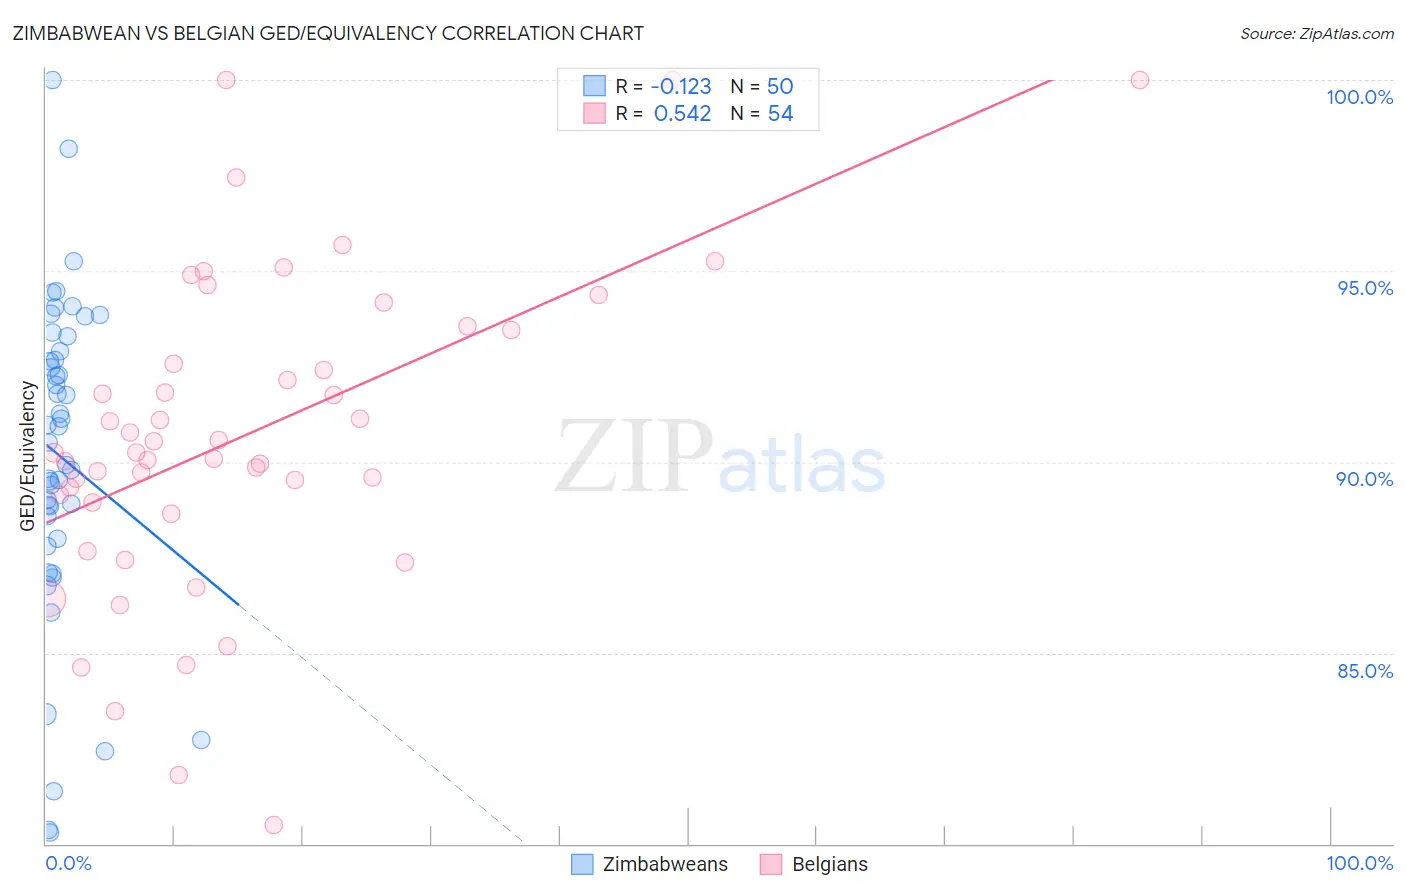
Zimbabwean vs Belgian GED/Equivalency Correlation Chart
The statistical analysis conducted on geographies consisting of 69,202,202 people shows a poor negative correlation between the proportion of Zimbabweans and percentage of population with at least ged/equivalency education in the United States with a correlation coefficient (R) of -0.123 and weighted average of 88.0%. Similarly, the statistical analysis conducted on geographies consisting of 356,019,518 people shows a substantial positive correlation between the proportion of Belgians and percentage of population with at least ged/equivalency education in the United States with a correlation coefficient (R) of 0.542 and weighted average of 87.7%, a difference of 0.35%.
GED/Equivalency Correlation Summary
| Measurement | Zimbabwean | Belgian |
| Minimum | 80.3% | 80.5% |
| Maximum | 100.0% | 100.0% |
| Range | 19.7% | 19.5% |
| Mean | 90.1% | 90.7% |
| Median | 90.7% | 90.2% |
| Interquartile 25% (IQ1) | 88.0% | 88.9% |
| Interquartile 75% (IQ3) | 92.9% | 93.5% |
| Interquartile Range (IQR) | 4.9% | 4.5% |
| Standard Deviation (Sample) | 4.2% | 4.2% |
| Standard Deviation (Population) | 4.2% | 4.1% |
Similar Demographics by GED/Equivalency
Demographics Similar to Zimbabweans by GED/Equivalency
In terms of ged/equivalency, the demographic groups most similar to Zimbabweans are Immigrants from Netherlands (88.0%, a difference of 0.0%), Immigrants from South Africa (88.0%, a difference of 0.0%), Soviet Union (88.0%, a difference of 0.010%), New Zealander (88.0%, a difference of 0.010%), and Immigrants from Denmark (88.0%, a difference of 0.030%).
| Demographics | Rating | Rank | GED/Equivalency |
| Czechs | 99.5 /100 | #45 | Exceptional 88.1% |
| Immigrants | Switzerland | 99.5 /100 | #46 | Exceptional 88.1% |
| Immigrants | Latvia | 99.5 /100 | #47 | Exceptional 88.1% |
| Greeks | 99.5 /100 | #48 | Exceptional 88.1% |
| Australians | 99.5 /100 | #49 | Exceptional 88.1% |
| Immigrants | Korea | 99.5 /100 | #50 | Exceptional 88.1% |
| Immigrants | Netherlands | 99.4 /100 | #51 | Exceptional 88.0% |
| Zimbabweans | 99.4 /100 | #52 | Exceptional 88.0% |
| Immigrants | South Africa | 99.4 /100 | #53 | Exceptional 88.0% |
| Soviet Union | 99.4 /100 | #54 | Exceptional 88.0% |
| New Zealanders | 99.4 /100 | #55 | Exceptional 88.0% |
| Immigrants | Denmark | 99.4 /100 | #56 | Exceptional 88.0% |
| Immigrants | Czechoslovakia | 99.3 /100 | #57 | Exceptional 87.9% |
| Northern Europeans | 99.3 /100 | #58 | Exceptional 87.9% |
| Serbians | 99.3 /100 | #59 | Exceptional 87.9% |
Demographics Similar to Belgians by GED/Equivalency
In terms of ged/equivalency, the demographic groups most similar to Belgians are Ukrainian (87.7%, a difference of 0.010%), Austrian (87.7%, a difference of 0.010%), Immigrants from Moldova (87.7%, a difference of 0.010%), Immigrants from Kuwait (87.7%, a difference of 0.020%), and Scottish (87.7%, a difference of 0.030%).
| Demographics | Rating | Rank | GED/Equivalency |
| Immigrants | Bulgaria | 99.1 /100 | #66 | Exceptional 87.8% |
| British | 99.1 /100 | #67 | Exceptional 87.8% |
| Immigrants | France | 99.1 /100 | #68 | Exceptional 87.8% |
| Immigrants | Saudi Arabia | 99.0 /100 | #69 | Exceptional 87.8% |
| Ukrainians | 98.8 /100 | #70 | Exceptional 87.7% |
| Austrians | 98.8 /100 | #71 | Exceptional 87.7% |
| Immigrants | Moldova | 98.8 /100 | #72 | Exceptional 87.7% |
| Belgians | 98.8 /100 | #73 | Exceptional 87.7% |
| Immigrants | Kuwait | 98.8 /100 | #74 | Exceptional 87.7% |
| Scottish | 98.7 /100 | #75 | Exceptional 87.7% |
| Immigrants | Serbia | 98.7 /100 | #76 | Exceptional 87.7% |
| Slavs | 98.7 /100 | #77 | Exceptional 87.7% |
| Irish | 98.6 /100 | #78 | Exceptional 87.6% |
| English | 98.6 /100 | #79 | Exceptional 87.6% |
| Immigrants | England | 98.5 /100 | #80 | Exceptional 87.6% |