Vietnamese vs Immigrants from Spain 6th Grade
COMPARE
Vietnamese
Immigrants from Spain
6th Grade
6th Grade Comparison
Vietnamese
Immigrants from Spain
95.3%
6TH GRADE
0.0/ 100
METRIC RATING
317th/ 347
METRIC RANK
97.0%
6TH GRADE
39.9/ 100
METRIC RATING
180th/ 347
METRIC RANK
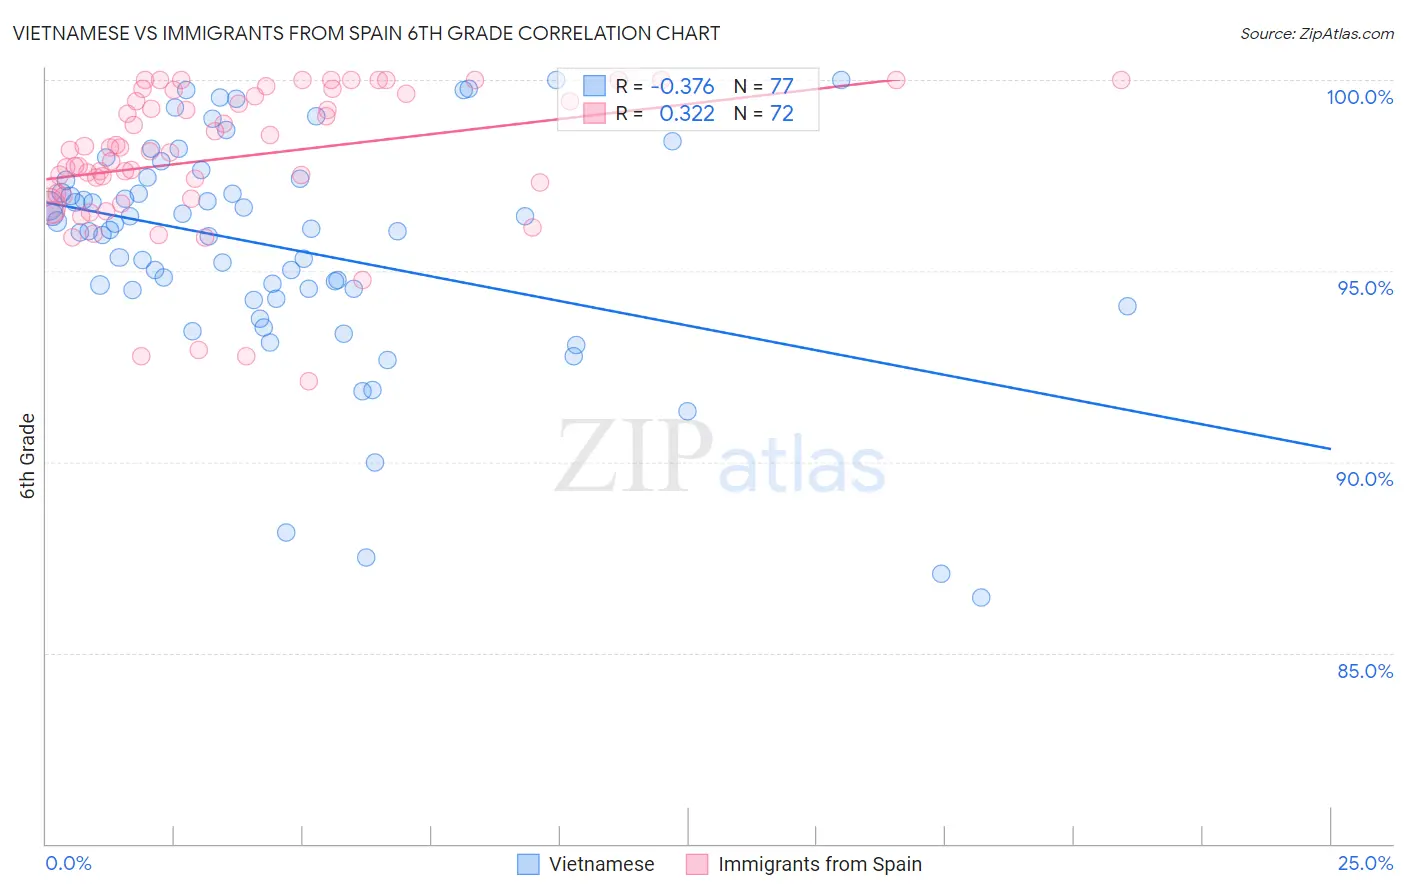
Vietnamese vs Immigrants from Spain 6th Grade Correlation Chart
The statistical analysis conducted on geographies consisting of 170,728,240 people shows a mild negative correlation between the proportion of Vietnamese and percentage of population with at least 6th grade education in the United States with a correlation coefficient (R) of -0.376 and weighted average of 95.3%. Similarly, the statistical analysis conducted on geographies consisting of 239,682,725 people shows a mild positive correlation between the proportion of Immigrants from Spain and percentage of population with at least 6th grade education in the United States with a correlation coefficient (R) of 0.322 and weighted average of 97.0%, a difference of 1.8%.
6th Grade Correlation Summary
| Measurement | Vietnamese | Immigrants from Spain |
| Minimum | 86.5% | 92.1% |
| Maximum | 100.0% | 100.0% |
| Range | 13.5% | 7.9% |
| Mean | 95.6% | 98.0% |
| Median | 96.1% | 98.1% |
| Interquartile 25% (IQ1) | 94.4% | 97.0% |
| Interquartile 75% (IQ3) | 97.4% | 99.6% |
| Interquartile Range (IQR) | 3.0% | 2.6% |
| Standard Deviation (Sample) | 2.9% | 1.9% |
| Standard Deviation (Population) | 2.9% | 1.9% |
Similar Demographics by 6th Grade
Demographics Similar to Vietnamese by 6th Grade
In terms of 6th grade, the demographic groups most similar to Vietnamese are Belizean (95.3%, a difference of 0.020%), Japanese (95.4%, a difference of 0.030%), Immigrants from Belize (95.3%, a difference of 0.030%), Immigrants from Bangladesh (95.4%, a difference of 0.040%), and Immigrants from Vietnam (95.4%, a difference of 0.050%).
| Demographics | Rating | Rank | 6th Grade |
| Ecuadorians | 0.0 /100 | #310 | Tragic 95.5% |
| Immigrants | Portugal | 0.0 /100 | #311 | Tragic 95.5% |
| Immigrants | Guyana | 0.0 /100 | #312 | Tragic 95.5% |
| Nicaraguans | 0.0 /100 | #313 | Tragic 95.4% |
| Immigrants | Vietnam | 0.0 /100 | #314 | Tragic 95.4% |
| Immigrants | Bangladesh | 0.0 /100 | #315 | Tragic 95.4% |
| Japanese | 0.0 /100 | #316 | Tragic 95.4% |
| Vietnamese | 0.0 /100 | #317 | Tragic 95.3% |
| Belizeans | 0.0 /100 | #318 | Tragic 95.3% |
| Immigrants | Belize | 0.0 /100 | #319 | Tragic 95.3% |
| Immigrants | Ecuador | 0.0 /100 | #320 | Tragic 95.3% |
| Immigrants | Fiji | 0.0 /100 | #321 | Tragic 95.2% |
| Immigrants | Cambodia | 0.0 /100 | #322 | Tragic 95.2% |
| Central American Indians | 0.0 /100 | #323 | Tragic 95.1% |
| Cape Verdeans | 0.0 /100 | #324 | Tragic 95.1% |
Demographics Similar to Immigrants from Spain by 6th Grade
In terms of 6th grade, the demographic groups most similar to Immigrants from Spain are Comanche (97.0%, a difference of 0.010%), Immigrants from Ukraine (97.0%, a difference of 0.020%), Immigrants from Kazakhstan (97.0%, a difference of 0.030%), Immigrants from Micronesia (97.0%, a difference of 0.030%), and Mongolian (97.0%, a difference of 0.030%).
| Demographics | Rating | Rank | 6th Grade |
| Arabs | 50.1 /100 | #173 | Average 97.0% |
| Venezuelans | 50.0 /100 | #174 | Average 97.0% |
| Immigrants | Kazakhstan | 47.3 /100 | #175 | Average 97.0% |
| Immigrants | Micronesia | 47.1 /100 | #176 | Average 97.0% |
| Mongolians | 46.7 /100 | #177 | Average 97.0% |
| Pakistanis | 46.0 /100 | #178 | Average 97.0% |
| Immigrants | Kenya | 45.3 /100 | #179 | Average 97.0% |
| Immigrants | Spain | 39.9 /100 | #180 | Fair 97.0% |
| Comanche | 37.9 /100 | #181 | Fair 97.0% |
| Immigrants | Ukraine | 35.6 /100 | #182 | Fair 97.0% |
| Immigrants | Venezuela | 34.5 /100 | #183 | Fair 97.0% |
| Spanish Americans | 33.5 /100 | #184 | Fair 97.0% |
| Argentineans | 33.0 /100 | #185 | Fair 97.0% |
| Immigrants | Egypt | 31.4 /100 | #186 | Fair 97.0% |
| Guamanians/Chamorros | 30.6 /100 | #187 | Fair 97.0% |