Scottish vs Immigrants from Spain 6th Grade
COMPARE
Scottish
Immigrants from Spain
6th Grade
6th Grade Comparison
Scottish
Immigrants from Spain
98.1%
6TH GRADE
100.0/ 100
METRIC RATING
16th/ 347
METRIC RANK
97.0%
6TH GRADE
39.9/ 100
METRIC RATING
180th/ 347
METRIC RANK
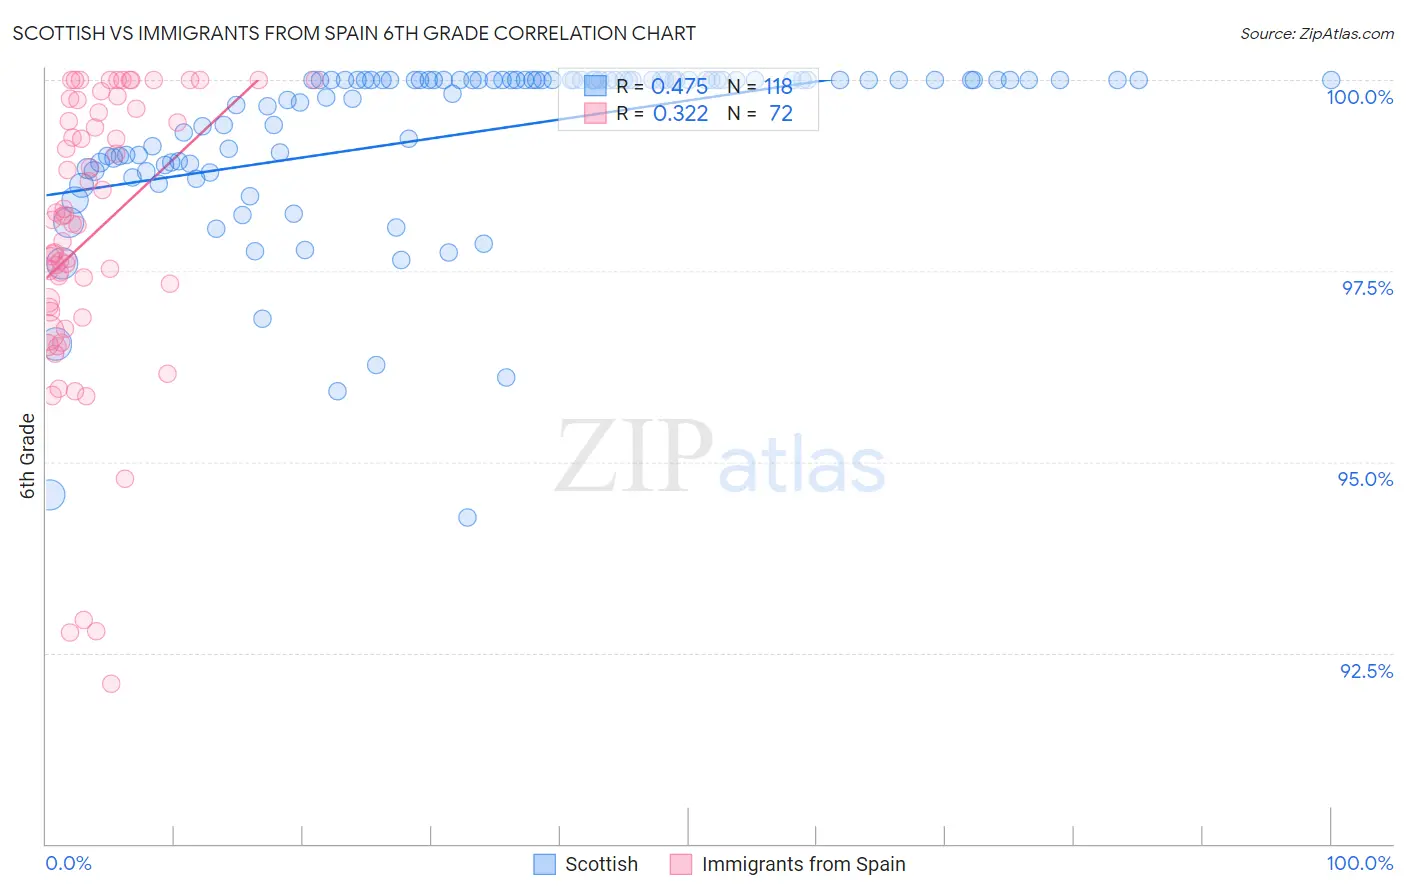
Scottish vs Immigrants from Spain 6th Grade Correlation Chart
The statistical analysis conducted on geographies consisting of 567,141,733 people shows a moderate positive correlation between the proportion of Scottish and percentage of population with at least 6th grade education in the United States with a correlation coefficient (R) of 0.475 and weighted average of 98.1%. Similarly, the statistical analysis conducted on geographies consisting of 239,682,725 people shows a mild positive correlation between the proportion of Immigrants from Spain and percentage of population with at least 6th grade education in the United States with a correlation coefficient (R) of 0.322 and weighted average of 97.0%, a difference of 1.1%.
6th Grade Correlation Summary
| Measurement | Scottish | Immigrants from Spain |
| Minimum | 94.3% | 92.1% |
| Maximum | 100.0% | 100.0% |
| Range | 5.7% | 7.9% |
| Mean | 99.3% | 98.0% |
| Median | 100.0% | 98.1% |
| Interquartile 25% (IQ1) | 98.9% | 97.0% |
| Interquartile 75% (IQ3) | 100.0% | 99.6% |
| Interquartile Range (IQR) | 1.1% | 2.6% |
| Standard Deviation (Sample) | 1.1% | 1.9% |
| Standard Deviation (Population) | 1.1% | 1.9% |
Similar Demographics by 6th Grade
Demographics Similar to Scottish by 6th Grade
In terms of 6th grade, the demographic groups most similar to Scottish are Carpatho Rusyn (98.1%, a difference of 0.010%), Inupiat (98.1%, a difference of 0.010%), Polish (98.1%, a difference of 0.010%), Pennsylvania German (98.1%, a difference of 0.010%), and Irish (98.1%, a difference of 0.010%).
| Demographics | Rating | Rank | 6th Grade |
| Slovenes | 100.0 /100 | #9 | Exceptional 98.2% |
| Swedes | 100.0 /100 | #10 | Exceptional 98.2% |
| English | 100.0 /100 | #11 | Exceptional 98.1% |
| Alaskan Athabascans | 100.0 /100 | #12 | Exceptional 98.1% |
| Tlingit-Haida | 100.0 /100 | #13 | Exceptional 98.1% |
| Carpatho Rusyns | 100.0 /100 | #14 | Exceptional 98.1% |
| Inupiat | 100.0 /100 | #15 | Exceptional 98.1% |
| Scottish | 100.0 /100 | #16 | Exceptional 98.1% |
| Poles | 100.0 /100 | #17 | Exceptional 98.1% |
| Pennsylvania Germans | 100.0 /100 | #18 | Exceptional 98.1% |
| Irish | 100.0 /100 | #19 | Exceptional 98.1% |
| Finns | 100.0 /100 | #20 | Exceptional 98.1% |
| Lithuanians | 100.0 /100 | #21 | Exceptional 98.1% |
| Danes | 100.0 /100 | #22 | Exceptional 98.0% |
| Sioux | 100.0 /100 | #23 | Exceptional 98.0% |
Demographics Similar to Immigrants from Spain by 6th Grade
In terms of 6th grade, the demographic groups most similar to Immigrants from Spain are Comanche (97.0%, a difference of 0.010%), Immigrants from Ukraine (97.0%, a difference of 0.020%), Immigrants from Kazakhstan (97.0%, a difference of 0.030%), Immigrants from Micronesia (97.0%, a difference of 0.030%), and Mongolian (97.0%, a difference of 0.030%).
| Demographics | Rating | Rank | 6th Grade |
| Arabs | 50.1 /100 | #173 | Average 97.0% |
| Venezuelans | 50.0 /100 | #174 | Average 97.0% |
| Immigrants | Kazakhstan | 47.3 /100 | #175 | Average 97.0% |
| Immigrants | Micronesia | 47.1 /100 | #176 | Average 97.0% |
| Mongolians | 46.7 /100 | #177 | Average 97.0% |
| Pakistanis | 46.0 /100 | #178 | Average 97.0% |
| Immigrants | Kenya | 45.3 /100 | #179 | Average 97.0% |
| Immigrants | Spain | 39.9 /100 | #180 | Fair 97.0% |
| Comanche | 37.9 /100 | #181 | Fair 97.0% |
| Immigrants | Ukraine | 35.6 /100 | #182 | Fair 97.0% |
| Immigrants | Venezuela | 34.5 /100 | #183 | Fair 97.0% |
| Spanish Americans | 33.5 /100 | #184 | Fair 97.0% |
| Argentineans | 33.0 /100 | #185 | Fair 97.0% |
| Immigrants | Egypt | 31.4 /100 | #186 | Fair 97.0% |
| Guamanians/Chamorros | 30.6 /100 | #187 | Fair 97.0% |