Vietnamese vs Immigrants from Lithuania 4th Grade
COMPARE
Vietnamese
Immigrants from Lithuania
4th Grade
4th Grade Comparison
Vietnamese
Immigrants from Lithuania
96.2%
4TH GRADE
0.0/ 100
METRIC RATING
314th/ 347
METRIC RANK
98.0%
4TH GRADE
99.3/ 100
METRIC RATING
77th/ 347
METRIC RANK
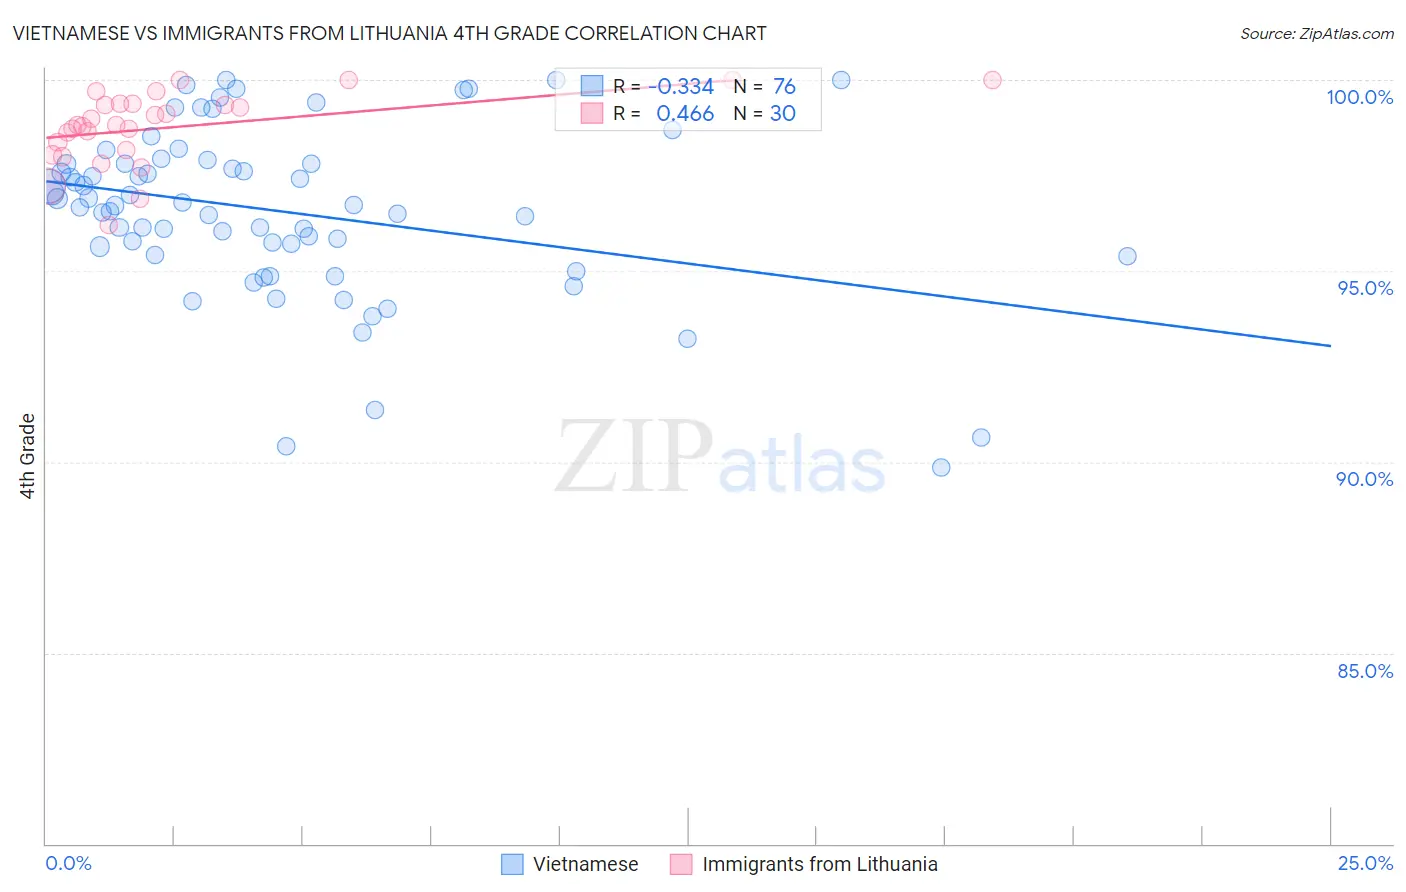
Vietnamese vs Immigrants from Lithuania 4th Grade Correlation Chart
The statistical analysis conducted on geographies consisting of 170,726,780 people shows a mild negative correlation between the proportion of Vietnamese and percentage of population with at least 4th grade education in the United States with a correlation coefficient (R) of -0.334 and weighted average of 96.2%. Similarly, the statistical analysis conducted on geographies consisting of 117,724,932 people shows a moderate positive correlation between the proportion of Immigrants from Lithuania and percentage of population with at least 4th grade education in the United States with a correlation coefficient (R) of 0.466 and weighted average of 98.0%, a difference of 1.8%.
4th Grade Correlation Summary
| Measurement | Vietnamese | Immigrants from Lithuania |
| Minimum | 89.8% | 96.2% |
| Maximum | 100.0% | 100.0% |
| Range | 10.2% | 3.8% |
| Mean | 96.6% | 98.8% |
| Median | 96.7% | 98.8% |
| Interquartile 25% (IQ1) | 95.5% | 98.2% |
| Interquartile 75% (IQ3) | 97.8% | 99.4% |
| Interquartile Range (IQR) | 2.3% | 1.2% |
| Standard Deviation (Sample) | 2.2% | 0.95% |
| Standard Deviation (Population) | 2.2% | 0.93% |
Similar Demographics by 4th Grade
Demographics Similar to Vietnamese by 4th Grade
In terms of 4th grade, the demographic groups most similar to Vietnamese are Indonesian (96.2%, a difference of 0.0%), Nicaraguan (96.2%, a difference of 0.010%), Immigrants from Ecuador (96.2%, a difference of 0.010%), Cape Verdean (96.2%, a difference of 0.020%), and Immigrants from Bangladesh (96.2%, a difference of 0.030%).
| Demographics | Rating | Rank | 4th Grade |
| Immigrants | Haiti | 0.0 /100 | #307 | Tragic 96.3% |
| Immigrants | Laos | 0.0 /100 | #308 | Tragic 96.3% |
| Immigrants | Guyana | 0.0 /100 | #309 | Tragic 96.3% |
| Immigrants | Burma/Myanmar | 0.0 /100 | #310 | Tragic 96.3% |
| Immigrants | Bangladesh | 0.0 /100 | #311 | Tragic 96.2% |
| Cape Verdeans | 0.0 /100 | #312 | Tragic 96.2% |
| Indonesians | 0.0 /100 | #313 | Tragic 96.2% |
| Vietnamese | 0.0 /100 | #314 | Tragic 96.2% |
| Nicaraguans | 0.0 /100 | #315 | Tragic 96.2% |
| Immigrants | Ecuador | 0.0 /100 | #316 | Tragic 96.2% |
| Central American Indians | 0.0 /100 | #317 | Tragic 96.2% |
| Immigrants | Azores | 0.0 /100 | #318 | Tragic 96.1% |
| Belizeans | 0.0 /100 | #319 | Tragic 96.1% |
| Bangladeshis | 0.0 /100 | #320 | Tragic 96.1% |
| Japanese | 0.0 /100 | #321 | Tragic 96.0% |
Demographics Similar to Immigrants from Lithuania by 4th Grade
In terms of 4th grade, the demographic groups most similar to Immigrants from Lithuania are Immigrants from Netherlands (98.0%, a difference of 0.0%), Cherokee (98.0%, a difference of 0.0%), Immigrants from England (98.0%, a difference of 0.0%), Ukrainian (98.0%, a difference of 0.010%), and Osage (98.0%, a difference of 0.010%).
| Demographics | Rating | Rank | 4th Grade |
| Immigrants | Austria | 99.6 /100 | #70 | Exceptional 98.0% |
| Lumbee | 99.6 /100 | #71 | Exceptional 98.0% |
| Iranians | 99.4 /100 | #72 | Exceptional 98.0% |
| Macedonians | 99.4 /100 | #73 | Exceptional 98.0% |
| Chickasaw | 99.4 /100 | #74 | Exceptional 98.0% |
| Immigrants | Netherlands | 99.3 /100 | #75 | Exceptional 98.0% |
| Cherokee | 99.3 /100 | #76 | Exceptional 98.0% |
| Immigrants | Lithuania | 99.3 /100 | #77 | Exceptional 98.0% |
| Immigrants | England | 99.3 /100 | #78 | Exceptional 98.0% |
| Ukrainians | 99.2 /100 | #79 | Exceptional 98.0% |
| Osage | 99.2 /100 | #80 | Exceptional 98.0% |
| Immigrants | India | 99.1 /100 | #81 | Exceptional 98.0% |
| Icelanders | 99.1 /100 | #82 | Exceptional 98.0% |
| Immigrants | Belgium | 99.0 /100 | #83 | Exceptional 97.9% |
| Cypriots | 98.9 /100 | #84 | Exceptional 97.9% |