Vietnamese vs Fijian 4th Grade
COMPARE
Vietnamese
Fijian
4th Grade
4th Grade Comparison
Vietnamese
Fijians
96.2%
4TH GRADE
0.0/ 100
METRIC RATING
314th/ 347
METRIC RANK
96.9%
4TH GRADE
0.1/ 100
METRIC RATING
272nd/ 347
METRIC RANK
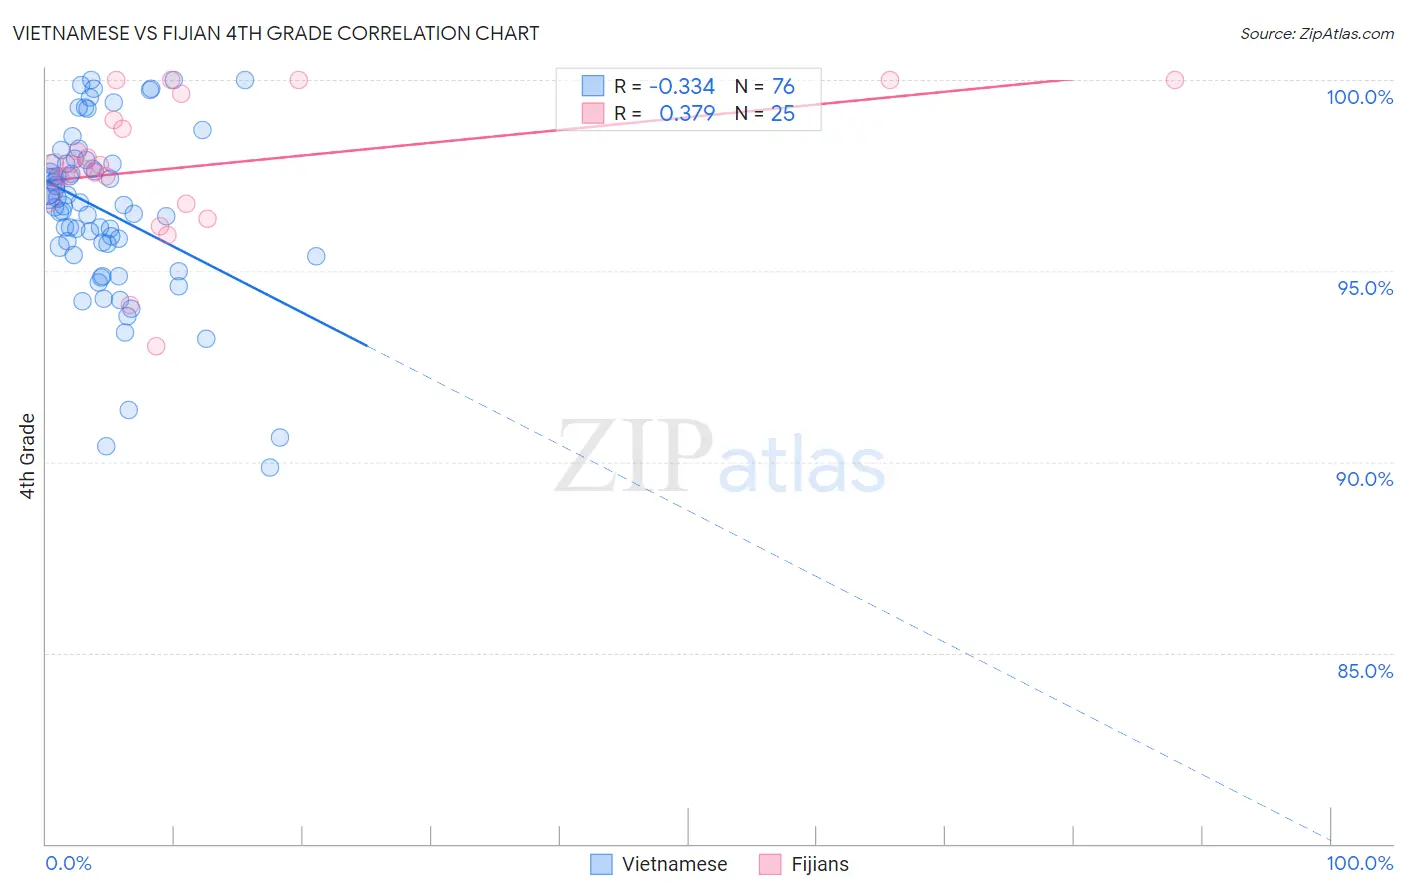
Vietnamese vs Fijian 4th Grade Correlation Chart
The statistical analysis conducted on geographies consisting of 170,726,780 people shows a mild negative correlation between the proportion of Vietnamese and percentage of population with at least 4th grade education in the United States with a correlation coefficient (R) of -0.334 and weighted average of 96.2%. Similarly, the statistical analysis conducted on geographies consisting of 55,948,842 people shows a mild positive correlation between the proportion of Fijians and percentage of population with at least 4th grade education in the United States with a correlation coefficient (R) of 0.379 and weighted average of 96.9%, a difference of 0.72%.
4th Grade Correlation Summary
| Measurement | Vietnamese | Fijian |
| Minimum | 89.8% | 93.0% |
| Maximum | 100.0% | 100.0% |
| Range | 10.2% | 7.0% |
| Mean | 96.6% | 97.7% |
| Median | 96.7% | 97.8% |
| Interquartile 25% (IQ1) | 95.5% | 96.8% |
| Interquartile 75% (IQ3) | 97.8% | 99.3% |
| Interquartile Range (IQR) | 2.3% | 2.5% |
| Standard Deviation (Sample) | 2.2% | 1.8% |
| Standard Deviation (Population) | 2.2% | 1.8% |
Similar Demographics by 4th Grade
Demographics Similar to Vietnamese by 4th Grade
In terms of 4th grade, the demographic groups most similar to Vietnamese are Indonesian (96.2%, a difference of 0.0%), Nicaraguan (96.2%, a difference of 0.010%), Immigrants from Ecuador (96.2%, a difference of 0.010%), Cape Verdean (96.2%, a difference of 0.020%), and Immigrants from Bangladesh (96.2%, a difference of 0.030%).
| Demographics | Rating | Rank | 4th Grade |
| Immigrants | Haiti | 0.0 /100 | #307 | Tragic 96.3% |
| Immigrants | Laos | 0.0 /100 | #308 | Tragic 96.3% |
| Immigrants | Guyana | 0.0 /100 | #309 | Tragic 96.3% |
| Immigrants | Burma/Myanmar | 0.0 /100 | #310 | Tragic 96.3% |
| Immigrants | Bangladesh | 0.0 /100 | #311 | Tragic 96.2% |
| Cape Verdeans | 0.0 /100 | #312 | Tragic 96.2% |
| Indonesians | 0.0 /100 | #313 | Tragic 96.2% |
| Vietnamese | 0.0 /100 | #314 | Tragic 96.2% |
| Nicaraguans | 0.0 /100 | #315 | Tragic 96.2% |
| Immigrants | Ecuador | 0.0 /100 | #316 | Tragic 96.2% |
| Central American Indians | 0.0 /100 | #317 | Tragic 96.2% |
| Immigrants | Azores | 0.0 /100 | #318 | Tragic 96.1% |
| Belizeans | 0.0 /100 | #319 | Tragic 96.1% |
| Bangladeshis | 0.0 /100 | #320 | Tragic 96.1% |
| Japanese | 0.0 /100 | #321 | Tragic 96.0% |
Demographics Similar to Fijians by 4th Grade
In terms of 4th grade, the demographic groups most similar to Fijians are Immigrants from Peru (96.9%, a difference of 0.0%), Immigrants from Cameroon (96.9%, a difference of 0.0%), Cuban (96.9%, a difference of 0.010%), Trinidadian and Tobagonian (96.9%, a difference of 0.010%), and Immigrants from Ghana (96.9%, a difference of 0.020%).
| Demographics | Rating | Rank | 4th Grade |
| Armenians | 0.3 /100 | #265 | Tragic 97.0% |
| Immigrants | China | 0.3 /100 | #266 | Tragic 97.0% |
| Immigrants | Nigeria | 0.3 /100 | #267 | Tragic 97.0% |
| Ghanaians | 0.2 /100 | #268 | Tragic 97.0% |
| Immigrants | Uzbekistan | 0.2 /100 | #269 | Tragic 96.9% |
| Cubans | 0.2 /100 | #270 | Tragic 96.9% |
| Immigrants | Peru | 0.1 /100 | #271 | Tragic 96.9% |
| Fijians | 0.1 /100 | #272 | Tragic 96.9% |
| Immigrants | Cameroon | 0.1 /100 | #273 | Tragic 96.9% |
| Trinidadians and Tobagonians | 0.1 /100 | #274 | Tragic 96.9% |
| Immigrants | Ghana | 0.1 /100 | #275 | Tragic 96.9% |
| Yaqui | 0.1 /100 | #276 | Tragic 96.9% |
| Immigrants | Western Africa | 0.1 /100 | #277 | Tragic 96.9% |
| Immigrants | Bolivia | 0.1 /100 | #278 | Tragic 96.9% |
| Afghans | 0.1 /100 | #279 | Tragic 96.9% |