Tsimshian vs Immigrants from Scotland 4th Grade
COMPARE
Tsimshian
Immigrants from Scotland
4th Grade
4th Grade Comparison
Tsimshian
Immigrants from Scotland
98.6%
4TH GRADE
100.0/ 100
METRIC RATING
3rd/ 347
METRIC RANK
98.1%
4TH GRADE
99.8/ 100
METRIC RATING
50th/ 347
METRIC RANK
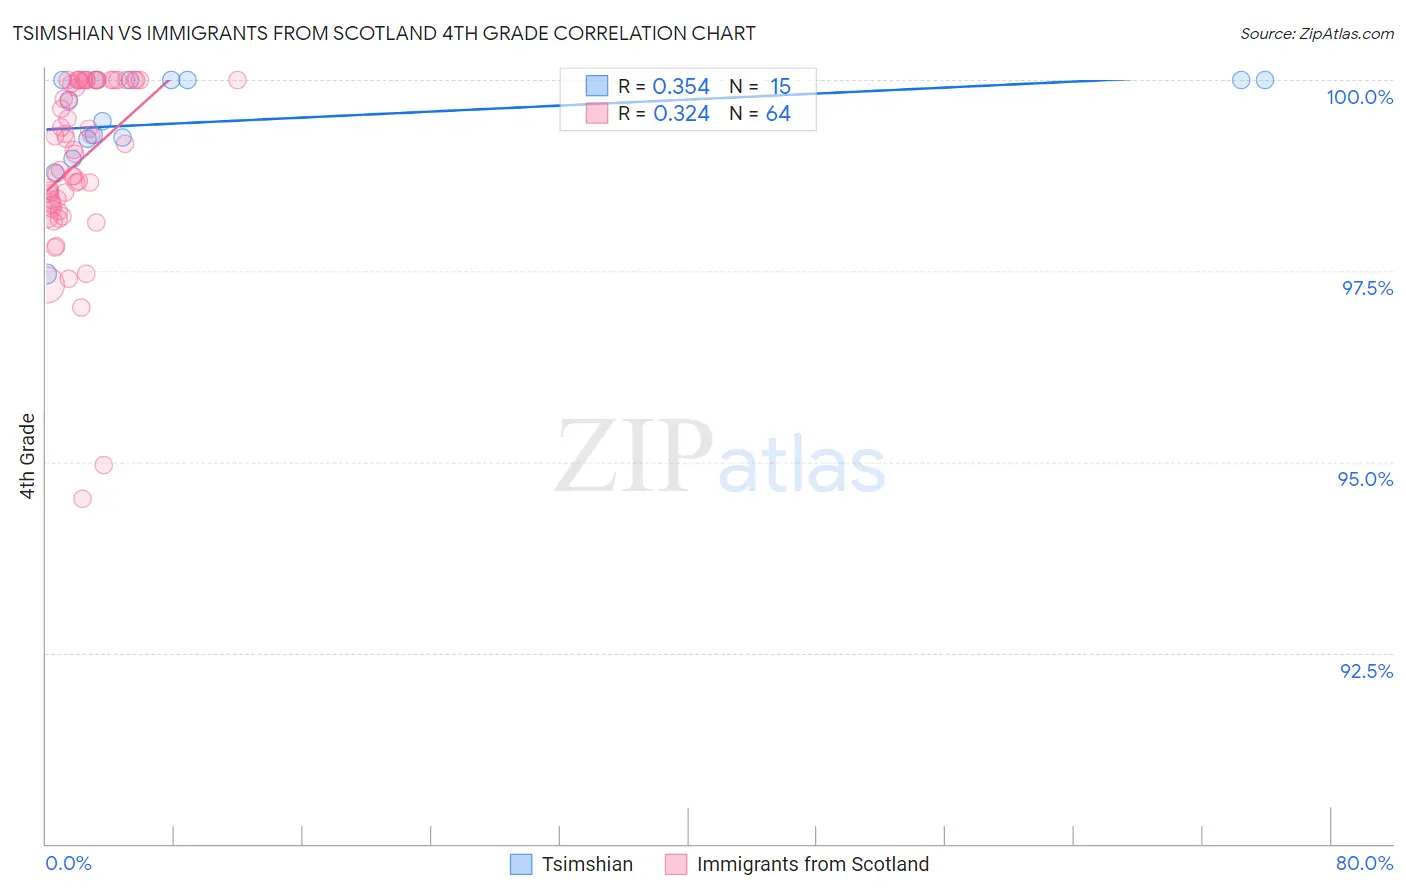
Tsimshian vs Immigrants from Scotland 4th Grade Correlation Chart
The statistical analysis conducted on geographies consisting of 15,626,544 people shows a mild positive correlation between the proportion of Tsimshian and percentage of population with at least 4th grade education in the United States with a correlation coefficient (R) of 0.354 and weighted average of 98.6%. Similarly, the statistical analysis conducted on geographies consisting of 196,398,887 people shows a mild positive correlation between the proportion of Immigrants from Scotland and percentage of population with at least 4th grade education in the United States with a correlation coefficient (R) of 0.324 and weighted average of 98.1%, a difference of 0.54%.
4th Grade Correlation Summary
| Measurement | Tsimshian | Immigrants from Scotland |
| Minimum | 97.5% | 94.5% |
| Maximum | 100.0% | 100.0% |
| Range | 2.5% | 5.5% |
| Mean | 99.5% | 98.9% |
| Median | 99.7% | 99.1% |
| Interquartile 25% (IQ1) | 99.2% | 98.4% |
| Interquartile 75% (IQ3) | 100.0% | 100.0% |
| Interquartile Range (IQR) | 0.77% | 1.6% |
| Standard Deviation (Sample) | 0.70% | 1.1% |
| Standard Deviation (Population) | 0.68% | 1.1% |
Similar Demographics by 4th Grade
Demographics Similar to Tsimshian by 4th Grade
In terms of 4th grade, the demographic groups most similar to Tsimshian are Welsh (98.7%, a difference of 0.060%), Inupiat (98.6%, a difference of 0.060%), Yup'ik (98.5%, a difference of 0.090%), Norwegian (98.5%, a difference of 0.13%), and Slovak (98.5%, a difference of 0.14%).
| Demographics | Rating | Rank | 4th Grade |
| Crow | 100.0 /100 | #1 | Exceptional 99.6% |
| Welsh | 100.0 /100 | #2 | Exceptional 98.7% |
| Tsimshian | 100.0 /100 | #3 | Exceptional 98.6% |
| Inupiat | 100.0 /100 | #4 | Exceptional 98.6% |
| Yup'ik | 100.0 /100 | #5 | Exceptional 98.5% |
| Norwegians | 100.0 /100 | #6 | Exceptional 98.5% |
| Slovaks | 100.0 /100 | #7 | Exceptional 98.5% |
| Germans | 100.0 /100 | #8 | Exceptional 98.5% |
| Slovenes | 100.0 /100 | #9 | Exceptional 98.4% |
| Alaskan Athabascans | 100.0 /100 | #10 | Exceptional 98.4% |
| English | 100.0 /100 | #11 | Exceptional 98.4% |
| Tlingit-Haida | 100.0 /100 | #12 | Exceptional 98.4% |
| Swedes | 100.0 /100 | #13 | Exceptional 98.4% |
| Carpatho Rusyns | 100.0 /100 | #14 | Exceptional 98.4% |
| Dutch | 100.0 /100 | #15 | Exceptional 98.4% |
Demographics Similar to Immigrants from Scotland by 4th Grade
In terms of 4th grade, the demographic groups most similar to Immigrants from Scotland are Bulgarian (98.1%, a difference of 0.0%), Celtic (98.1%, a difference of 0.0%), Estonian (98.1%, a difference of 0.010%), Australian (98.1%, a difference of 0.010%), and Slavic (98.1%, a difference of 0.010%).
| Demographics | Rating | Rank | 4th Grade |
| Northern Europeans | 99.9 /100 | #43 | Exceptional 98.2% |
| Native Hawaiians | 99.9 /100 | #44 | Exceptional 98.1% |
| Czechoslovakians | 99.9 /100 | #45 | Exceptional 98.1% |
| Ottawa | 99.9 /100 | #46 | Exceptional 98.1% |
| Arapaho | 99.9 /100 | #47 | Exceptional 98.1% |
| Estonians | 99.8 /100 | #48 | Exceptional 98.1% |
| Bulgarians | 99.8 /100 | #49 | Exceptional 98.1% |
| Immigrants | Scotland | 99.8 /100 | #50 | Exceptional 98.1% |
| Celtics | 99.8 /100 | #51 | Exceptional 98.1% |
| Australians | 99.8 /100 | #52 | Exceptional 98.1% |
| Slavs | 99.8 /100 | #53 | Exceptional 98.1% |
| Maltese | 99.8 /100 | #54 | Exceptional 98.1% |
| Whites/Caucasians | 99.8 /100 | #55 | Exceptional 98.1% |
| Greeks | 99.8 /100 | #56 | Exceptional 98.1% |
| Austrians | 99.8 /100 | #57 | Exceptional 98.1% |