Immigrants from Argentina vs Immigrants from Scotland 4th Grade
COMPARE
Immigrants from Argentina
Immigrants from Scotland
4th Grade
4th Grade Comparison
Immigrants from Argentina
Immigrants from Scotland
97.5%
4TH GRADE
34.6/ 100
METRIC RATING
188th/ 347
METRIC RANK
98.1%
4TH GRADE
99.8/ 100
METRIC RATING
50th/ 347
METRIC RANK
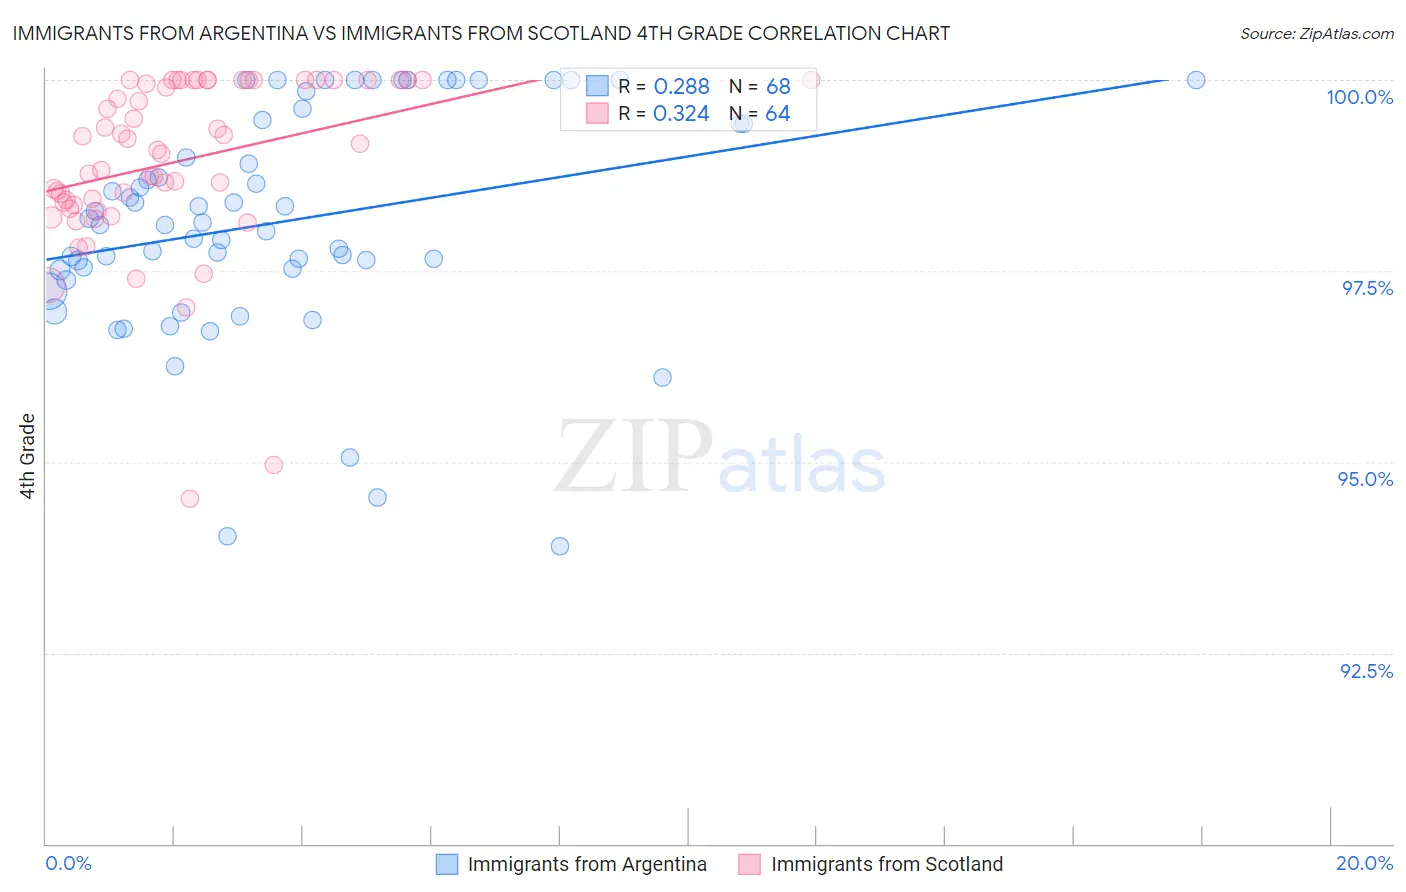
Immigrants from Argentina vs Immigrants from Scotland 4th Grade Correlation Chart
The statistical analysis conducted on geographies consisting of 264,434,317 people shows a weak positive correlation between the proportion of Immigrants from Argentina and percentage of population with at least 4th grade education in the United States with a correlation coefficient (R) of 0.288 and weighted average of 97.5%. Similarly, the statistical analysis conducted on geographies consisting of 196,398,887 people shows a mild positive correlation between the proportion of Immigrants from Scotland and percentage of population with at least 4th grade education in the United States with a correlation coefficient (R) of 0.324 and weighted average of 98.1%, a difference of 0.66%.
4th Grade Correlation Summary
| Measurement | Immigrants from Argentina | Immigrants from Scotland |
| Minimum | 93.9% | 94.5% |
| Maximum | 100.0% | 100.0% |
| Range | 6.1% | 5.5% |
| Mean | 98.1% | 98.9% |
| Median | 98.1% | 99.1% |
| Interquartile 25% (IQ1) | 97.5% | 98.4% |
| Interquartile 75% (IQ3) | 99.5% | 100.0% |
| Interquartile Range (IQR) | 1.9% | 1.6% |
| Standard Deviation (Sample) | 1.5% | 1.1% |
| Standard Deviation (Population) | 1.5% | 1.1% |
Similar Demographics by 4th Grade
Demographics Similar to Immigrants from Argentina by 4th Grade
In terms of 4th grade, the demographic groups most similar to Immigrants from Argentina are Immigrants from Kenya (97.5%, a difference of 0.0%), Dutch West Indian (97.5%, a difference of 0.0%), Mongolian (97.5%, a difference of 0.0%), Pakistani (97.5%, a difference of 0.010%), and Panamanian (97.4%, a difference of 0.010%).
| Demographics | Rating | Rank | 4th Grade |
| Immigrants | Taiwan | 41.5 /100 | #181 | Average 97.5% |
| Spanish Americans | 39.3 /100 | #182 | Fair 97.5% |
| Argentineans | 39.0 /100 | #183 | Fair 97.5% |
| Pakistanis | 36.2 /100 | #184 | Fair 97.5% |
| Immigrants | Kenya | 35.8 /100 | #185 | Fair 97.5% |
| Dutch West Indians | 35.8 /100 | #186 | Fair 97.5% |
| Mongolians | 34.7 /100 | #187 | Fair 97.5% |
| Immigrants | Argentina | 34.6 /100 | #188 | Fair 97.5% |
| Panamanians | 31.9 /100 | #189 | Fair 97.4% |
| Blacks/African Americans | 31.1 /100 | #190 | Fair 97.4% |
| Navajo | 30.7 /100 | #191 | Fair 97.4% |
| Immigrants | Ukraine | 30.1 /100 | #192 | Fair 97.4% |
| Immigrants | Egypt | 30.1 /100 | #193 | Fair 97.4% |
| Portuguese | 29.2 /100 | #194 | Fair 97.4% |
| Paraguayans | 28.9 /100 | #195 | Fair 97.4% |
Demographics Similar to Immigrants from Scotland by 4th Grade
In terms of 4th grade, the demographic groups most similar to Immigrants from Scotland are Bulgarian (98.1%, a difference of 0.0%), Celtic (98.1%, a difference of 0.0%), Estonian (98.1%, a difference of 0.010%), Australian (98.1%, a difference of 0.010%), and Slavic (98.1%, a difference of 0.010%).
| Demographics | Rating | Rank | 4th Grade |
| Northern Europeans | 99.9 /100 | #43 | Exceptional 98.2% |
| Native Hawaiians | 99.9 /100 | #44 | Exceptional 98.1% |
| Czechoslovakians | 99.9 /100 | #45 | Exceptional 98.1% |
| Ottawa | 99.9 /100 | #46 | Exceptional 98.1% |
| Arapaho | 99.9 /100 | #47 | Exceptional 98.1% |
| Estonians | 99.8 /100 | #48 | Exceptional 98.1% |
| Bulgarians | 99.8 /100 | #49 | Exceptional 98.1% |
| Immigrants | Scotland | 99.8 /100 | #50 | Exceptional 98.1% |
| Celtics | 99.8 /100 | #51 | Exceptional 98.1% |
| Australians | 99.8 /100 | #52 | Exceptional 98.1% |
| Slavs | 99.8 /100 | #53 | Exceptional 98.1% |
| Maltese | 99.8 /100 | #54 | Exceptional 98.1% |
| Whites/Caucasians | 99.8 /100 | #55 | Exceptional 98.1% |
| Greeks | 99.8 /100 | #56 | Exceptional 98.1% |
| Austrians | 99.8 /100 | #57 | Exceptional 98.1% |