Tsimshian vs Immigrants from Afghanistan 8th Grade
COMPARE
Tsimshian
Immigrants from Afghanistan
8th Grade
8th Grade Comparison
Tsimshian
Immigrants from Afghanistan
99.0%
8TH GRADE
100.0/ 100
METRIC RATING
2nd/ 347
METRIC RANK
94.8%
8TH GRADE
0.2/ 100
METRIC RATING
271st/ 347
METRIC RANK
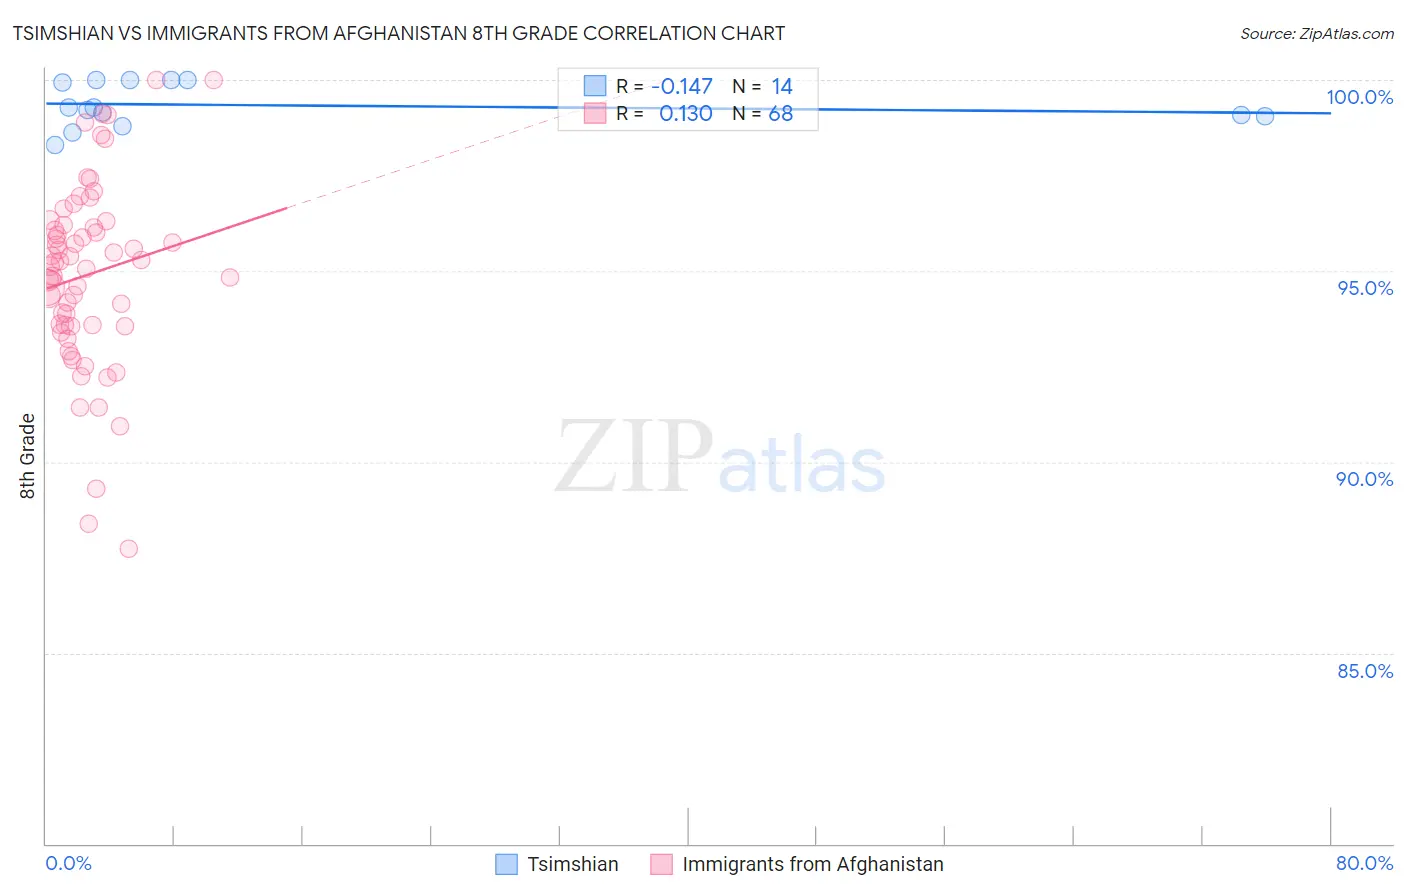
Tsimshian vs Immigrants from Afghanistan 8th Grade Correlation Chart
The statistical analysis conducted on geographies consisting of 221,806 people shows a poor negative correlation between the proportion of Tsimshian and percentage of population with at least 8th grade education in the United States with a correlation coefficient (R) of -0.147 and weighted average of 99.0%. Similarly, the statistical analysis conducted on geographies consisting of 147,629,924 people shows a poor positive correlation between the proportion of Immigrants from Afghanistan and percentage of population with at least 8th grade education in the United States with a correlation coefficient (R) of 0.130 and weighted average of 94.8%, a difference of 4.4%.
8th Grade Correlation Summary
| Measurement | Tsimshian | Immigrants from Afghanistan |
| Minimum | 98.3% | 87.7% |
| Maximum | 100.0% | 100.0% |
| Range | 1.7% | 12.3% |
| Mean | 99.3% | 94.9% |
| Median | 99.2% | 95.2% |
| Interquartile 25% (IQ1) | 99.1% | 93.6% |
| Interquartile 75% (IQ3) | 100.0% | 96.2% |
| Interquartile Range (IQR) | 0.93% | 2.6% |
| Standard Deviation (Sample) | 0.57% | 2.4% |
| Standard Deviation (Population) | 0.55% | 2.4% |
Similar Demographics by 8th Grade
Demographics Similar to Tsimshian by 8th Grade
In terms of 8th grade, the demographic groups most similar to Tsimshian are Crow (99.0%, a difference of 0.090%), Finnish (98.4%, a difference of 0.60%), Carpatho Rusyn (98.1%, a difference of 0.83%), Ottawa (97.9%, a difference of 1.0%), and Dutch (97.7%, a difference of 1.3%).
| Demographics | Rating | Rank | 8th Grade |
| Crow | 100.0 /100 | #1 | Exceptional 99.0% |
| Tsimshian | 100.0 /100 | #2 | Exceptional 99.0% |
| Finns | 100.0 /100 | #3 | Exceptional 98.4% |
| Carpatho Rusyns | 100.0 /100 | #4 | Exceptional 98.1% |
| Ottawa | 100.0 /100 | #5 | Exceptional 97.9% |
| Dutch | 100.0 /100 | #6 | Exceptional 97.7% |
| Norwegians | 100.0 /100 | #7 | Exceptional 97.6% |
| Slovaks | 100.0 /100 | #8 | Exceptional 97.6% |
| Germans | 100.0 /100 | #9 | Exceptional 97.5% |
| Slovenes | 100.0 /100 | #10 | Exceptional 97.5% |
| Poles | 100.0 /100 | #11 | Exceptional 97.4% |
| Swedes | 100.0 /100 | #12 | Exceptional 97.4% |
| Alaskan Athabascans | 100.0 /100 | #13 | Exceptional 97.3% |
| English | 100.0 /100 | #14 | Exceptional 97.3% |
| Pennsylvania Germans | 100.0 /100 | #15 | Exceptional 97.3% |
Demographics Similar to Immigrants from Afghanistan by 8th Grade
In terms of 8th grade, the demographic groups most similar to Immigrants from Afghanistan are Immigrants from Uzbekistan (94.8%, a difference of 0.010%), Immigrants from South America (94.8%, a difference of 0.010%), Immigrants from Western Africa (94.8%, a difference of 0.010%), Immigrants from Thailand (94.8%, a difference of 0.020%), and Trinidadian and Tobagonian (94.7%, a difference of 0.030%).
| Demographics | Rating | Rank | 8th Grade |
| South Americans | 0.4 /100 | #264 | Tragic 94.9% |
| Yuman | 0.4 /100 | #265 | Tragic 94.9% |
| West Indians | 0.3 /100 | #266 | Tragic 94.8% |
| Immigrants | Ghana | 0.3 /100 | #267 | Tragic 94.8% |
| Immigrants | Uruguay | 0.3 /100 | #268 | Tragic 94.8% |
| Immigrants | Thailand | 0.2 /100 | #269 | Tragic 94.8% |
| Immigrants | Uzbekistan | 0.2 /100 | #270 | Tragic 94.8% |
| Immigrants | Afghanistan | 0.2 /100 | #271 | Tragic 94.8% |
| Immigrants | South America | 0.2 /100 | #272 | Tragic 94.8% |
| Immigrants | Western Africa | 0.2 /100 | #273 | Tragic 94.8% |
| Trinidadians and Tobagonians | 0.2 /100 | #274 | Tragic 94.7% |
| Immigrants | Colombia | 0.2 /100 | #275 | Tragic 94.7% |
| Peruvians | 0.1 /100 | #276 | Tragic 94.7% |
| Taiwanese | 0.1 /100 | #277 | Tragic 94.7% |
| Armenians | 0.1 /100 | #278 | Tragic 94.7% |