Ethiopian vs Immigrants from Afghanistan 8th Grade
COMPARE
Ethiopian
Immigrants from Afghanistan
8th Grade
8th Grade Comparison
Ethiopians
Immigrants from Afghanistan
95.1%
8TH GRADE
2.0/ 100
METRIC RATING
240th/ 347
METRIC RANK
94.8%
8TH GRADE
0.2/ 100
METRIC RATING
271st/ 347
METRIC RANK
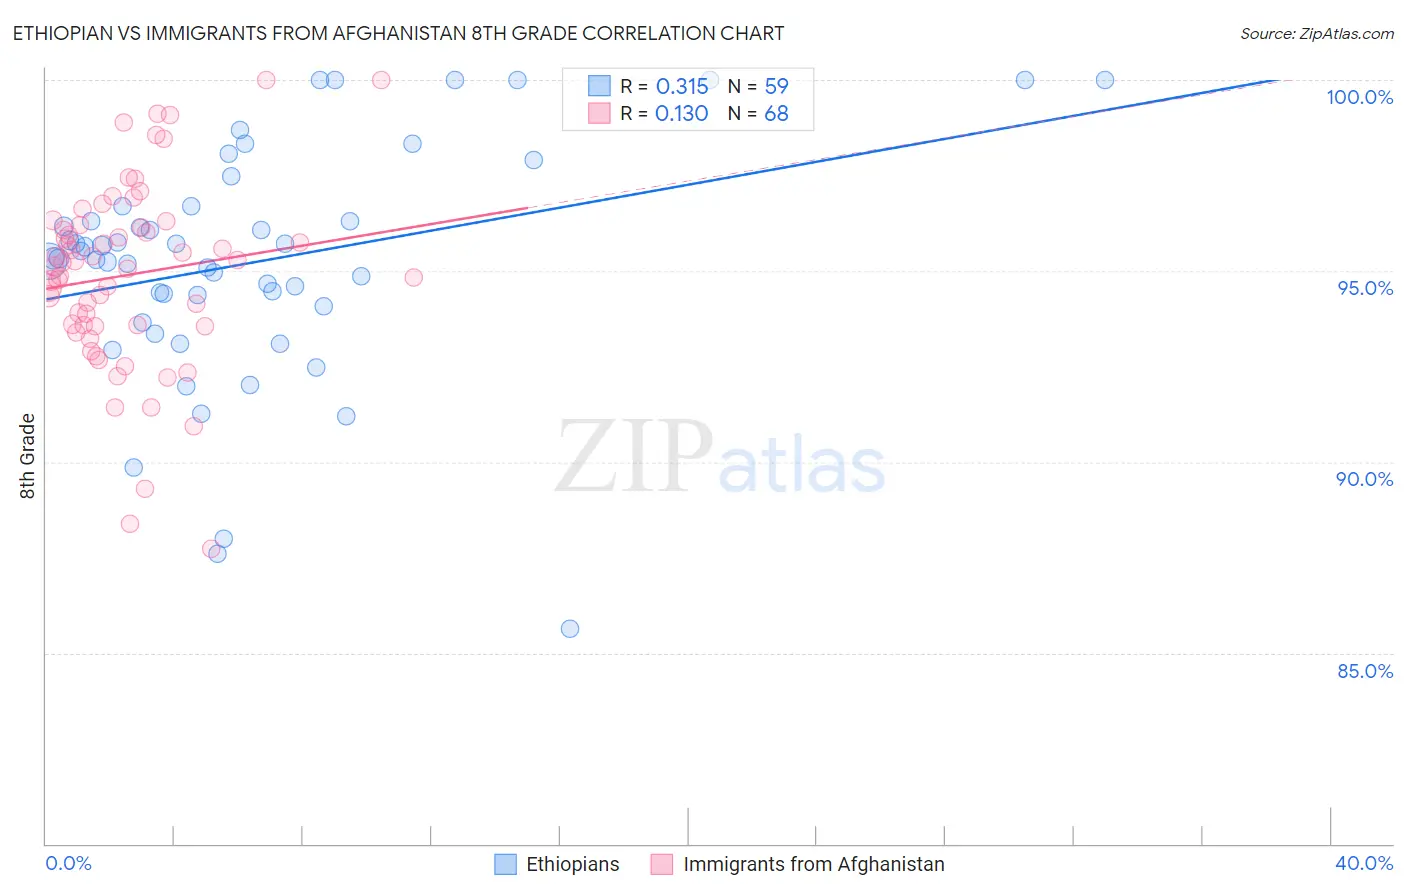
Ethiopian vs Immigrants from Afghanistan 8th Grade Correlation Chart
The statistical analysis conducted on geographies consisting of 223,135,094 people shows a mild positive correlation between the proportion of Ethiopians and percentage of population with at least 8th grade education in the United States with a correlation coefficient (R) of 0.315 and weighted average of 95.1%. Similarly, the statistical analysis conducted on geographies consisting of 147,629,924 people shows a poor positive correlation between the proportion of Immigrants from Afghanistan and percentage of population with at least 8th grade education in the United States with a correlation coefficient (R) of 0.130 and weighted average of 94.8%, a difference of 0.38%.
8th Grade Correlation Summary
| Measurement | Ethiopian | Immigrants from Afghanistan |
| Minimum | 85.6% | 87.7% |
| Maximum | 100.0% | 100.0% |
| Range | 14.4% | 12.3% |
| Mean | 95.2% | 94.9% |
| Median | 95.3% | 95.2% |
| Interquartile 25% (IQ1) | 94.1% | 93.6% |
| Interquartile 75% (IQ3) | 96.7% | 96.2% |
| Interquartile Range (IQR) | 2.6% | 2.6% |
| Standard Deviation (Sample) | 3.1% | 2.4% |
| Standard Deviation (Population) | 3.0% | 2.4% |
Similar Demographics by 8th Grade
Demographics Similar to Ethiopians by 8th Grade
In terms of 8th grade, the demographic groups most similar to Ethiopians are Immigrants from Sierra Leone (95.1%, a difference of 0.0%), South American Indian (95.1%, a difference of 0.010%), Native/Alaskan (95.2%, a difference of 0.020%), Tongan (95.1%, a difference of 0.020%), and Paiute (95.1%, a difference of 0.030%).
| Demographics | Rating | Rank | 8th Grade |
| Immigrants | Asia | 3.1 /100 | #233 | Tragic 95.2% |
| Costa Ricans | 3.0 /100 | #234 | Tragic 95.2% |
| Nigerians | 2.9 /100 | #235 | Tragic 95.2% |
| Senegalese | 2.7 /100 | #236 | Tragic 95.2% |
| Immigrants | Africa | 2.7 /100 | #237 | Tragic 95.2% |
| Natives/Alaskans | 2.3 /100 | #238 | Tragic 95.2% |
| Immigrants | Sierra Leone | 2.1 /100 | #239 | Tragic 95.1% |
| Ethiopians | 2.0 /100 | #240 | Tragic 95.1% |
| South American Indians | 1.9 /100 | #241 | Tragic 95.1% |
| Tongans | 1.7 /100 | #242 | Tragic 95.1% |
| Paiute | 1.7 /100 | #243 | Tragic 95.1% |
| Immigrants | Middle Africa | 1.7 /100 | #244 | Tragic 95.1% |
| Jamaicans | 1.4 /100 | #245 | Tragic 95.1% |
| Somalis | 1.4 /100 | #246 | Tragic 95.1% |
| Immigrants | Senegal | 1.4 /100 | #247 | Tragic 95.1% |
Demographics Similar to Immigrants from Afghanistan by 8th Grade
In terms of 8th grade, the demographic groups most similar to Immigrants from Afghanistan are Immigrants from Uzbekistan (94.8%, a difference of 0.010%), Immigrants from South America (94.8%, a difference of 0.010%), Immigrants from Western Africa (94.8%, a difference of 0.010%), Immigrants from Thailand (94.8%, a difference of 0.020%), and Trinidadian and Tobagonian (94.7%, a difference of 0.030%).
| Demographics | Rating | Rank | 8th Grade |
| South Americans | 0.4 /100 | #264 | Tragic 94.9% |
| Yuman | 0.4 /100 | #265 | Tragic 94.9% |
| West Indians | 0.3 /100 | #266 | Tragic 94.8% |
| Immigrants | Ghana | 0.3 /100 | #267 | Tragic 94.8% |
| Immigrants | Uruguay | 0.3 /100 | #268 | Tragic 94.8% |
| Immigrants | Thailand | 0.2 /100 | #269 | Tragic 94.8% |
| Immigrants | Uzbekistan | 0.2 /100 | #270 | Tragic 94.8% |
| Immigrants | Afghanistan | 0.2 /100 | #271 | Tragic 94.8% |
| Immigrants | South America | 0.2 /100 | #272 | Tragic 94.8% |
| Immigrants | Western Africa | 0.2 /100 | #273 | Tragic 94.8% |
| Trinidadians and Tobagonians | 0.2 /100 | #274 | Tragic 94.7% |
| Immigrants | Colombia | 0.2 /100 | #275 | Tragic 94.7% |
| Peruvians | 0.1 /100 | #276 | Tragic 94.7% |
| Taiwanese | 0.1 /100 | #277 | Tragic 94.7% |
| Armenians | 0.1 /100 | #278 | Tragic 94.7% |