Trinidadian and Tobagonian vs Immigrants from Korea Professional Degree
COMPARE
Trinidadian and Tobagonian
Immigrants from Korea
Professional Degree
Professional Degree Comparison
Trinidadians and Tobagonians
Immigrants from Korea
4.0%
PROFESSIONAL DEGREE
7.1/ 100
METRIC RATING
224th/ 347
METRIC RANK
6.1%
PROFESSIONAL DEGREE
100.0/ 100
METRIC RATING
35th/ 347
METRIC RANK
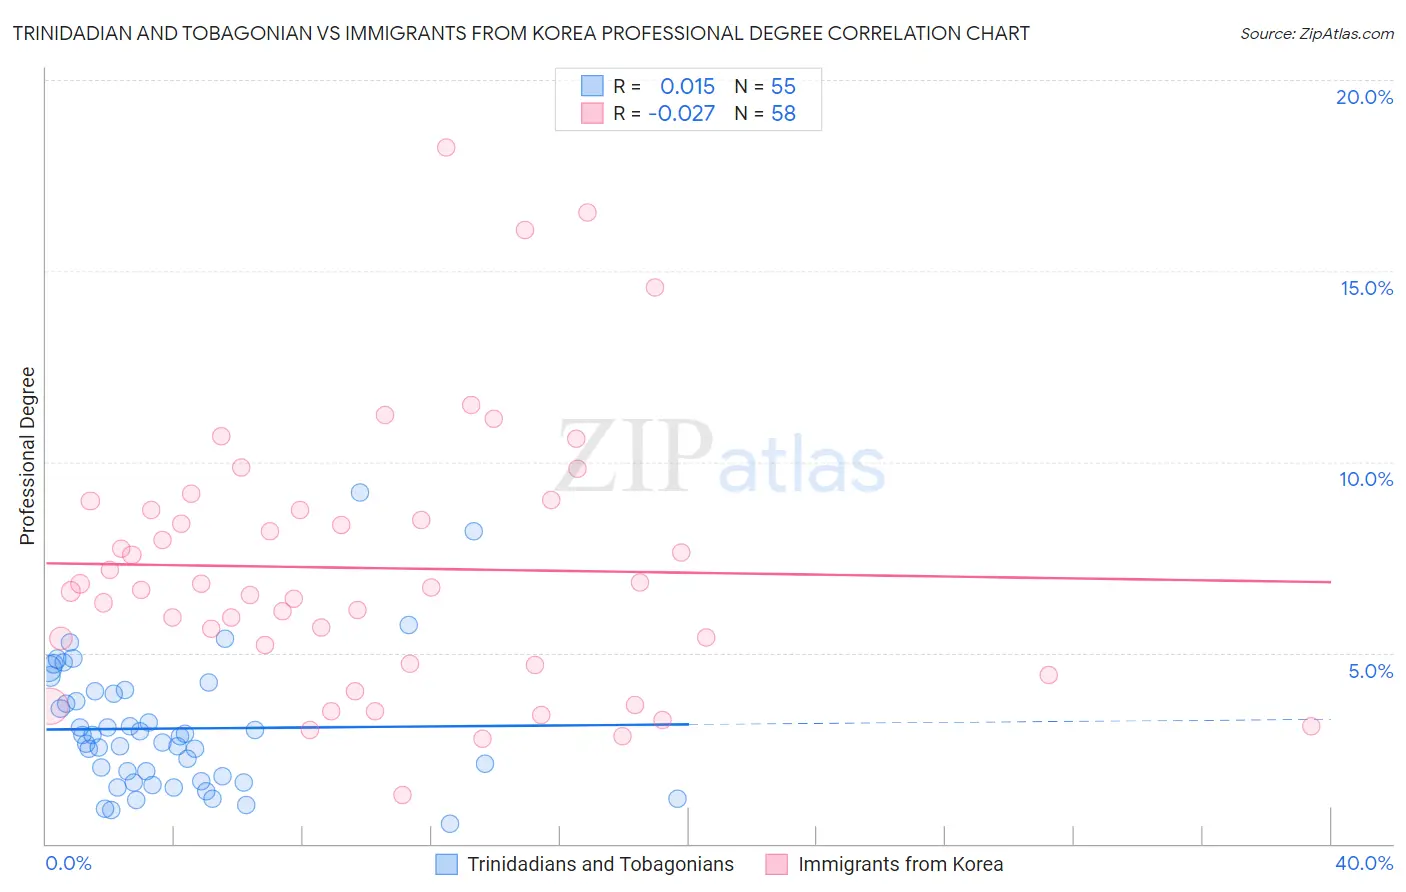
Trinidadian and Tobagonian vs Immigrants from Korea Professional Degree Correlation Chart
The statistical analysis conducted on geographies consisting of 219,572,491 people shows no correlation between the proportion of Trinidadians and Tobagonians and percentage of population with at least professional degree education in the United States with a correlation coefficient (R) of 0.015 and weighted average of 4.0%. Similarly, the statistical analysis conducted on geographies consisting of 415,494,018 people shows no correlation between the proportion of Immigrants from Korea and percentage of population with at least professional degree education in the United States with a correlation coefficient (R) of -0.027 and weighted average of 6.1%, a difference of 52.5%.
Professional Degree Correlation Summary
| Measurement | Trinidadian and Tobagonian | Immigrants from Korea |
| Minimum | 0.53% | 1.3% |
| Maximum | 9.2% | 18.2% |
| Range | 8.7% | 17.0% |
| Mean | 3.0% | 7.2% |
| Median | 2.8% | 6.7% |
| Interquartile 25% (IQ1) | 1.6% | 4.7% |
| Interquartile 75% (IQ3) | 4.0% | 8.7% |
| Interquartile Range (IQR) | 2.4% | 4.0% |
| Standard Deviation (Sample) | 1.7% | 3.5% |
| Standard Deviation (Population) | 1.7% | 3.5% |
Similar Demographics by Professional Degree
Demographics Similar to Trinidadians and Tobagonians by Professional Degree
In terms of professional degree, the demographic groups most similar to Trinidadians and Tobagonians are Tlingit-Haida (4.0%, a difference of 0.13%), Immigrants from Bosnia and Herzegovina (4.0%, a difference of 0.14%), Immigrants from Western Africa (4.0%, a difference of 0.22%), French Canadian (4.0%, a difference of 0.47%), and Ute (4.0%, a difference of 0.60%).
| Demographics | Rating | Rank | Professional Degree |
| Immigrants | Vietnam | 9.4 /100 | #217 | Tragic 4.0% |
| Dutch | 9.0 /100 | #218 | Tragic 4.0% |
| Immigrants | South Eastern Asia | 8.9 /100 | #219 | Tragic 4.0% |
| Ute | 8.2 /100 | #220 | Tragic 4.0% |
| French Canadians | 8.0 /100 | #221 | Tragic 4.0% |
| Immigrants | Western Africa | 7.5 /100 | #222 | Tragic 4.0% |
| Immigrants | Bosnia and Herzegovina | 7.4 /100 | #223 | Tragic 4.0% |
| Trinidadians and Tobagonians | 7.1 /100 | #224 | Tragic 4.0% |
| Tlingit-Haida | 6.9 /100 | #225 | Tragic 4.0% |
| German Russians | 6.1 /100 | #226 | Tragic 4.0% |
| Cubans | 5.9 /100 | #227 | Tragic 4.0% |
| Immigrants | West Indies | 5.6 /100 | #228 | Tragic 4.0% |
| Immigrants | Burma/Myanmar | 5.4 /100 | #229 | Tragic 3.9% |
| Nicaraguans | 5.1 /100 | #230 | Tragic 3.9% |
| Ecuadorians | 4.6 /100 | #231 | Tragic 3.9% |
Demographics Similar to Immigrants from Korea by Professional Degree
In terms of professional degree, the demographic groups most similar to Immigrants from Korea are Mongolian (6.1%, a difference of 0.66%), Burmese (6.1%, a difference of 0.80%), Thai (6.1%, a difference of 0.83%), Immigrants from Russia (6.0%, a difference of 0.90%), and Immigrants from India (6.2%, a difference of 1.1%).
| Demographics | Rating | Rank | Professional Degree |
| Turks | 100.0 /100 | #28 | Exceptional 6.2% |
| Immigrants | Sri Lanka | 100.0 /100 | #29 | Exceptional 6.2% |
| Immigrants | Turkey | 100.0 /100 | #30 | Exceptional 6.2% |
| Immigrants | India | 100.0 /100 | #31 | Exceptional 6.2% |
| Thais | 100.0 /100 | #32 | Exceptional 6.1% |
| Burmese | 100.0 /100 | #33 | Exceptional 6.1% |
| Mongolians | 100.0 /100 | #34 | Exceptional 6.1% |
| Immigrants | Korea | 100.0 /100 | #35 | Exceptional 6.1% |
| Immigrants | Russia | 100.0 /100 | #36 | Exceptional 6.0% |
| Immigrants | Austria | 100.0 /100 | #37 | Exceptional 6.0% |
| Immigrants | Norway | 100.0 /100 | #38 | Exceptional 6.0% |
| Immigrants | South Africa | 100.0 /100 | #39 | Exceptional 6.0% |
| Cambodians | 100.0 /100 | #40 | Exceptional 6.0% |
| New Zealanders | 100.0 /100 | #41 | Exceptional 6.0% |
| Estonians | 100.0 /100 | #42 | Exceptional 6.0% |