Immigrants from Latvia vs Immigrants from Korea Professional Degree
COMPARE
Immigrants from Latvia
Immigrants from Korea
Professional Degree
Professional Degree Comparison
Immigrants from Latvia
Immigrants from Korea
5.8%
PROFESSIONAL DEGREE
100.0/ 100
METRIC RATING
49th/ 347
METRIC RANK
6.1%
PROFESSIONAL DEGREE
100.0/ 100
METRIC RATING
35th/ 347
METRIC RANK
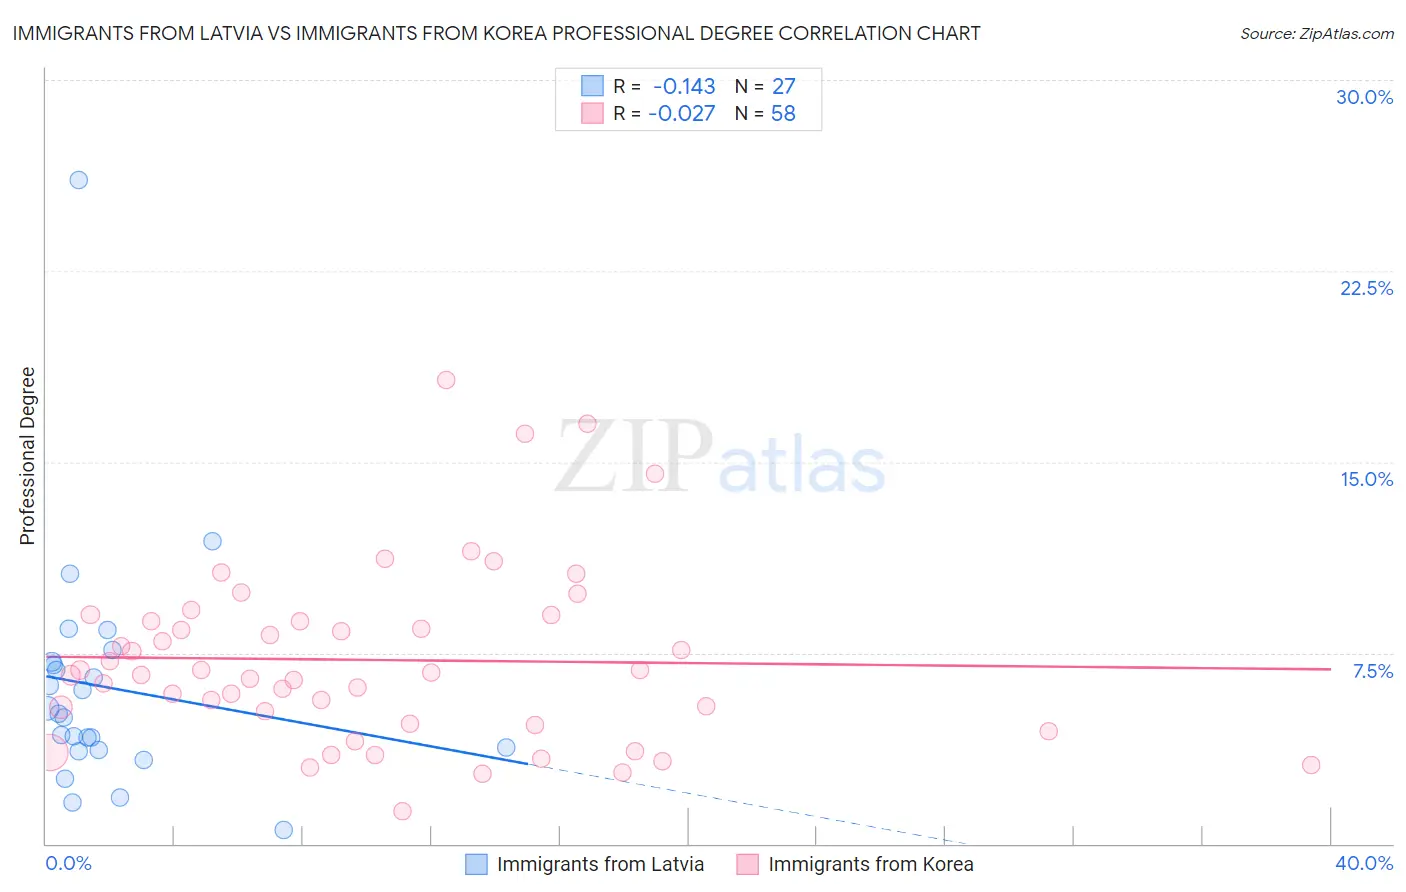
Immigrants from Latvia vs Immigrants from Korea Professional Degree Correlation Chart
The statistical analysis conducted on geographies consisting of 113,713,162 people shows a poor negative correlation between the proportion of Immigrants from Latvia and percentage of population with at least professional degree education in the United States with a correlation coefficient (R) of -0.143 and weighted average of 5.8%. Similarly, the statistical analysis conducted on geographies consisting of 415,494,018 people shows no correlation between the proportion of Immigrants from Korea and percentage of population with at least professional degree education in the United States with a correlation coefficient (R) of -0.027 and weighted average of 6.1%, a difference of 4.4%.
Professional Degree Correlation Summary
| Measurement | Immigrants from Latvia | Immigrants from Korea |
| Minimum | 0.54% | 1.3% |
| Maximum | 26.1% | 18.2% |
| Range | 25.5% | 17.0% |
| Mean | 6.1% | 7.2% |
| Median | 5.1% | 6.7% |
| Interquartile 25% (IQ1) | 3.7% | 4.7% |
| Interquartile 75% (IQ3) | 7.1% | 8.7% |
| Interquartile Range (IQR) | 3.4% | 4.0% |
| Standard Deviation (Sample) | 4.8% | 3.5% |
| Standard Deviation (Population) | 4.7% | 3.5% |
Demographics Similar to Immigrants from Latvia and Immigrants from Korea by Professional Degree
In terms of professional degree, the demographic groups most similar to Immigrants from Latvia are Immigrants from Czechoslovakia (5.8%, a difference of 0.32%), Immigrants from Greece (5.8%, a difference of 0.38%), Paraguayan (5.9%, a difference of 0.40%), Immigrants from Serbia (5.8%, a difference of 0.45%), and Australian (5.9%, a difference of 0.82%). Similarly, the demographic groups most similar to Immigrants from Korea are Mongolian (6.1%, a difference of 0.66%), Burmese (6.1%, a difference of 0.80%), Thai (6.1%, a difference of 0.83%), Immigrants from Russia (6.0%, a difference of 0.90%), and Immigrants from Austria (6.0%, a difference of 1.2%).
| Demographics | Rating | Rank | Professional Degree |
| Thais | 100.0 /100 | #32 | Exceptional 6.1% |
| Burmese | 100.0 /100 | #33 | Exceptional 6.1% |
| Mongolians | 100.0 /100 | #34 | Exceptional 6.1% |
| Immigrants | Korea | 100.0 /100 | #35 | Exceptional 6.1% |
| Immigrants | Russia | 100.0 /100 | #36 | Exceptional 6.0% |
| Immigrants | Austria | 100.0 /100 | #37 | Exceptional 6.0% |
| Immigrants | Norway | 100.0 /100 | #38 | Exceptional 6.0% |
| Immigrants | South Africa | 100.0 /100 | #39 | Exceptional 6.0% |
| Cambodians | 100.0 /100 | #40 | Exceptional 6.0% |
| New Zealanders | 100.0 /100 | #41 | Exceptional 6.0% |
| Estonians | 100.0 /100 | #42 | Exceptional 6.0% |
| Immigrants | Saudi Arabia | 100.0 /100 | #43 | Exceptional 5.9% |
| Argentineans | 100.0 /100 | #44 | Exceptional 5.9% |
| Immigrants | South Central Asia | 100.0 /100 | #45 | Exceptional 5.9% |
| Immigrants | Argentina | 100.0 /100 | #46 | Exceptional 5.9% |
| Australians | 100.0 /100 | #47 | Exceptional 5.9% |
| Paraguayans | 100.0 /100 | #48 | Exceptional 5.9% |
| Immigrants | Latvia | 100.0 /100 | #49 | Exceptional 5.8% |
| Immigrants | Czechoslovakia | 100.0 /100 | #50 | Exceptional 5.8% |
| Immigrants | Greece | 100.0 /100 | #51 | Exceptional 5.8% |
| Immigrants | Serbia | 100.0 /100 | #52 | Exceptional 5.8% |