Tohono O'odham vs Nigerian Nursery School
COMPARE
Tohono O'odham
Nigerian
Nursery School
Nursery School Comparison
Tohono O'odham
Nigerians
97.9%
NURSERY SCHOOL
22.2/ 100
METRIC RATING
200th/ 347
METRIC RANK
97.7%
NURSERY SCHOOL
1.7/ 100
METRIC RATING
238th/ 347
METRIC RANK
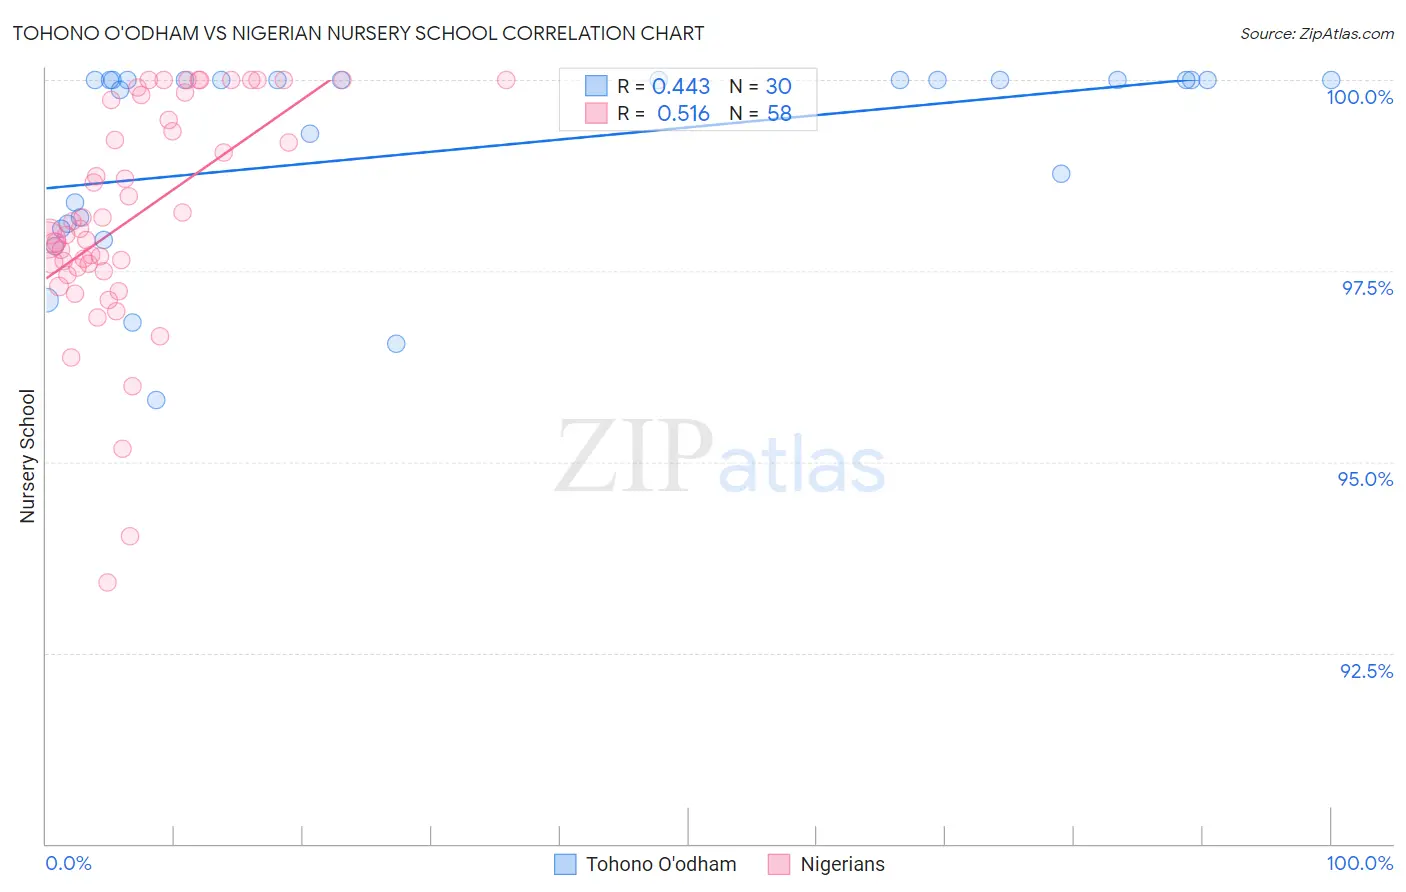
Tohono O'odham vs Nigerian Nursery School Correlation Chart
The statistical analysis conducted on geographies consisting of 58,723,100 people shows a moderate positive correlation between the proportion of Tohono O'odham and percentage of population with at least nursery school education in the United States with a correlation coefficient (R) of 0.443 and weighted average of 97.9%. Similarly, the statistical analysis conducted on geographies consisting of 332,724,627 people shows a substantial positive correlation between the proportion of Nigerians and percentage of population with at least nursery school education in the United States with a correlation coefficient (R) of 0.516 and weighted average of 97.7%, a difference of 0.21%.
Nursery School Correlation Summary
| Measurement | Tohono O'odham | Nigerian |
| Minimum | 95.8% | 93.4% |
| Maximum | 100.0% | 100.0% |
| Range | 4.2% | 6.6% |
| Mean | 99.1% | 98.2% |
| Median | 100.0% | 98.0% |
| Interquartile 25% (IQ1) | 98.1% | 97.5% |
| Interquartile 75% (IQ3) | 100.0% | 99.7% |
| Interquartile Range (IQR) | 1.9% | 2.2% |
| Standard Deviation (Sample) | 1.3% | 1.5% |
| Standard Deviation (Population) | 1.3% | 1.5% |
Similar Demographics by Nursery School
Demographics Similar to Tohono O'odham by Nursery School
In terms of nursery school, the demographic groups most similar to Tohono O'odham are Immigrants from Egypt (97.9%, a difference of 0.0%), Immigrants from Lebanon (97.9%, a difference of 0.0%), Guamanian/Chamorro (97.9%, a difference of 0.010%), Yuman (97.9%, a difference of 0.010%), and Immigrants from Kenya (97.9%, a difference of 0.010%).
| Demographics | Rating | Rank | Nursery School |
| Paraguayans | 27.4 /100 | #193 | Fair 97.9% |
| Mongolians | 27.3 /100 | #194 | Fair 97.9% |
| Hawaiians | 27.2 /100 | #195 | Fair 97.9% |
| Guamanians/Chamorros | 25.7 /100 | #196 | Fair 97.9% |
| Yuman | 25.7 /100 | #197 | Fair 97.9% |
| Immigrants | Kenya | 24.1 /100 | #198 | Fair 97.9% |
| Immigrants | Egypt | 22.5 /100 | #199 | Fair 97.9% |
| Tohono O'odham | 22.2 /100 | #200 | Fair 97.9% |
| Immigrants | Lebanon | 21.2 /100 | #201 | Fair 97.9% |
| Immigrants | Ukraine | 19.9 /100 | #202 | Poor 97.9% |
| Immigrants | Uganda | 18.0 /100 | #203 | Poor 97.9% |
| Immigrants | Southern Europe | 17.4 /100 | #204 | Poor 97.9% |
| Immigrants | Chile | 17.3 /100 | #205 | Poor 97.9% |
| Immigrants | Albania | 16.4 /100 | #206 | Poor 97.9% |
| Africans | 15.4 /100 | #207 | Poor 97.9% |
Demographics Similar to Nigerians by Nursery School
In terms of nursery school, the demographic groups most similar to Nigerians are Immigrants from Malaysia (97.7%, a difference of 0.010%), Immigrants from Western Asia (97.7%, a difference of 0.010%), Immigrants from Eastern Asia (97.7%, a difference of 0.010%), Korean (97.7%, a difference of 0.010%), and Immigrants from Uruguay (97.7%, a difference of 0.020%).
| Demographics | Rating | Rank | Nursery School |
| Puerto Ricans | 2.6 /100 | #231 | Tragic 97.7% |
| Immigrants | Uruguay | 2.3 /100 | #232 | Tragic 97.7% |
| U.S. Virgin Islanders | 2.1 /100 | #233 | Tragic 97.7% |
| Colombians | 2.1 /100 | #234 | Tragic 97.7% |
| Immigrants | Pakistan | 2.1 /100 | #235 | Tragic 97.7% |
| Immigrants | Malaysia | 1.9 /100 | #236 | Tragic 97.7% |
| Immigrants | Western Asia | 1.9 /100 | #237 | Tragic 97.7% |
| Nigerians | 1.7 /100 | #238 | Tragic 97.7% |
| Immigrants | Eastern Asia | 1.6 /100 | #239 | Tragic 97.7% |
| Koreans | 1.4 /100 | #240 | Tragic 97.7% |
| Immigrants | Indonesia | 1.1 /100 | #241 | Tragic 97.7% |
| Liberians | 1.1 /100 | #242 | Tragic 97.7% |
| Asians | 1.1 /100 | #243 | Tragic 97.6% |
| South Americans | 1.0 /100 | #244 | Tragic 97.6% |
| Bolivians | 1.0 /100 | #245 | Tragic 97.6% |