Thai vs Immigrants from Canada 1st Grade
COMPARE
Thai
Immigrants from Canada
1st Grade
1st Grade Comparison
Thais
Immigrants from Canada
98.1%
1ST GRADE
94.7/ 100
METRIC RATING
119th/ 347
METRIC RANK
98.4%
1ST GRADE
99.7/ 100
METRIC RATING
60th/ 347
METRIC RANK
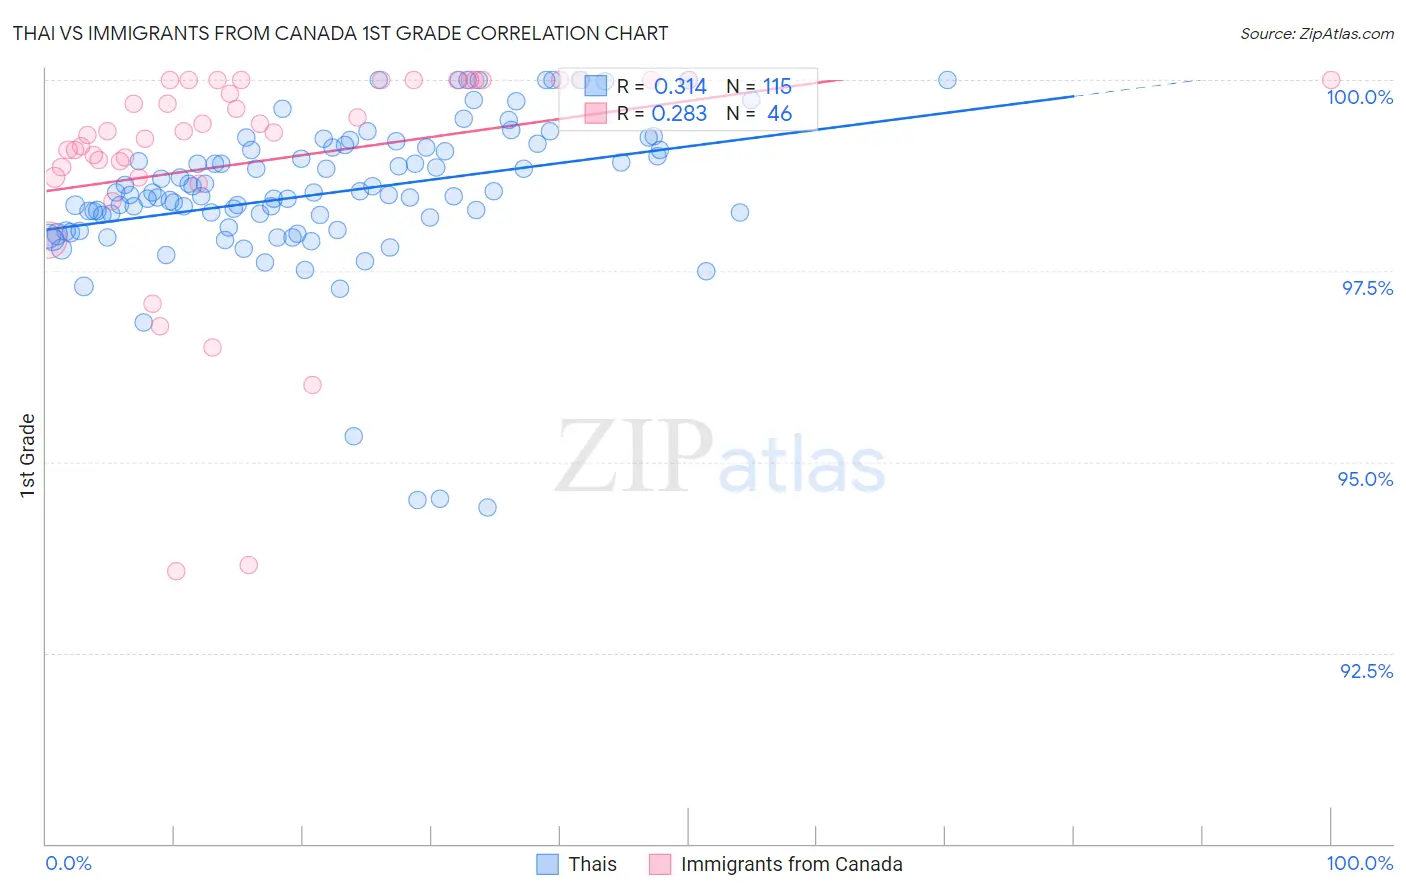
Thai vs Immigrants from Canada 1st Grade Correlation Chart
The statistical analysis conducted on geographies consisting of 475,866,115 people shows a mild positive correlation between the proportion of Thais and percentage of population with at least 1st grade education in the United States with a correlation coefficient (R) of 0.314 and weighted average of 98.1%. Similarly, the statistical analysis conducted on geographies consisting of 459,397,554 people shows a weak positive correlation between the proportion of Immigrants from Canada and percentage of population with at least 1st grade education in the United States with a correlation coefficient (R) of 0.283 and weighted average of 98.4%, a difference of 0.24%.
1st Grade Correlation Summary
| Measurement | Thai | Immigrants from Canada |
| Minimum | 94.4% | 93.6% |
| Maximum | 100.0% | 100.0% |
| Range | 5.6% | 6.4% |
| Mean | 98.5% | 98.9% |
| Median | 98.5% | 99.3% |
| Interquartile 25% (IQ1) | 98.1% | 98.9% |
| Interquartile 75% (IQ3) | 99.1% | 100.0% |
| Interquartile Range (IQR) | 1.0% | 1.1% |
| Standard Deviation (Sample) | 1.0% | 1.5% |
| Standard Deviation (Population) | 1.0% | 1.5% |
Similar Demographics by 1st Grade
Demographics Similar to Thais by 1st Grade
In terms of 1st grade, the demographic groups most similar to Thais are Okinawan (98.1%, a difference of 0.0%), Yugoslavian (98.2%, a difference of 0.010%), Immigrants from France (98.2%, a difference of 0.010%), Immigrants from Zimbabwe (98.1%, a difference of 0.010%), and Menominee (98.1%, a difference of 0.010%).
| Demographics | Rating | Rank | 1st Grade |
| Immigrants | Norway | 96.6 /100 | #112 | Exceptional 98.2% |
| Immigrants | Latvia | 96.4 /100 | #113 | Exceptional 98.2% |
| Ute | 96.2 /100 | #114 | Exceptional 98.2% |
| Iranians | 96.0 /100 | #115 | Exceptional 98.2% |
| Spanish | 95.9 /100 | #116 | Exceptional 98.2% |
| Yugoslavians | 95.5 /100 | #117 | Exceptional 98.2% |
| Immigrants | France | 95.5 /100 | #118 | Exceptional 98.2% |
| Thais | 94.7 /100 | #119 | Exceptional 98.1% |
| Okinawans | 94.5 /100 | #120 | Exceptional 98.1% |
| Immigrants | Zimbabwe | 94.0 /100 | #121 | Exceptional 98.1% |
| Menominee | 93.9 /100 | #122 | Exceptional 98.1% |
| Iroquois | 93.8 /100 | #123 | Exceptional 98.1% |
| Syrians | 93.7 /100 | #124 | Exceptional 98.1% |
| Immigrants | Japan | 93.7 /100 | #125 | Exceptional 98.1% |
| Lebanese | 93.5 /100 | #126 | Exceptional 98.1% |
Demographics Similar to Immigrants from Canada by 1st Grade
In terms of 1st grade, the demographic groups most similar to Immigrants from Canada are New Zealander (98.4%, a difference of 0.0%), Creek (98.4%, a difference of 0.0%), Bulgarian (98.4%, a difference of 0.0%), Slavic (98.4%, a difference of 0.0%), and Immigrants from North America (98.4%, a difference of 0.0%).
| Demographics | Rating | Rank | 1st Grade |
| Kiowa | 99.8 /100 | #53 | Exceptional 98.4% |
| Australians | 99.8 /100 | #54 | Exceptional 98.4% |
| Immigrants | Scotland | 99.8 /100 | #55 | Exceptional 98.4% |
| Americans | 99.8 /100 | #56 | Exceptional 98.4% |
| Austrians | 99.8 /100 | #57 | Exceptional 98.4% |
| New Zealanders | 99.7 /100 | #58 | Exceptional 98.4% |
| Creek | 99.7 /100 | #59 | Exceptional 98.4% |
| Immigrants | Canada | 99.7 /100 | #60 | Exceptional 98.4% |
| Bulgarians | 99.7 /100 | #61 | Exceptional 98.4% |
| Slavs | 99.7 /100 | #62 | Exceptional 98.4% |
| Immigrants | North America | 99.7 /100 | #63 | Exceptional 98.4% |
| Greeks | 99.7 /100 | #64 | Exceptional 98.4% |
| Maltese | 99.7 /100 | #65 | Exceptional 98.4% |
| Canadians | 99.6 /100 | #66 | Exceptional 98.3% |
| Immigrants | Austria | 99.6 /100 | #67 | Exceptional 98.3% |