Thai vs Immigrants from Argentina 1st Grade
COMPARE
Thai
Immigrants from Argentina
1st Grade
1st Grade Comparison
Thais
Immigrants from Argentina
98.1%
1ST GRADE
94.7/ 100
METRIC RATING
119th/ 347
METRIC RANK
97.9%
1ST GRADE
41.3/ 100
METRIC RATING
183rd/ 347
METRIC RANK
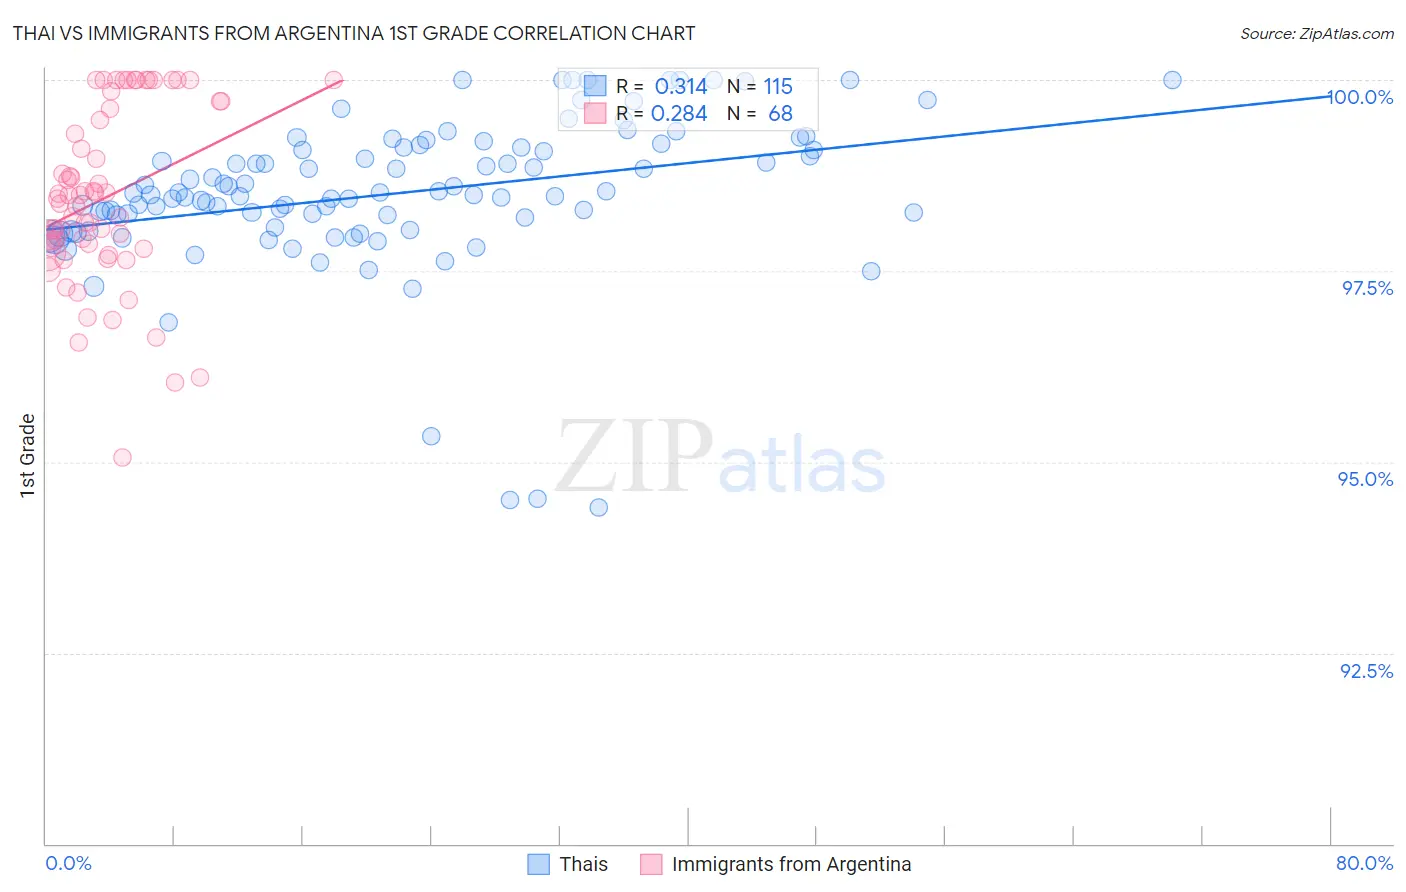
Thai vs Immigrants from Argentina 1st Grade Correlation Chart
The statistical analysis conducted on geographies consisting of 475,866,115 people shows a mild positive correlation between the proportion of Thais and percentage of population with at least 1st grade education in the United States with a correlation coefficient (R) of 0.314 and weighted average of 98.1%. Similarly, the statistical analysis conducted on geographies consisting of 264,435,492 people shows a weak positive correlation between the proportion of Immigrants from Argentina and percentage of population with at least 1st grade education in the United States with a correlation coefficient (R) of 0.284 and weighted average of 97.9%, a difference of 0.25%.
1st Grade Correlation Summary
| Measurement | Thai | Immigrants from Argentina |
| Minimum | 94.4% | 95.1% |
| Maximum | 100.0% | 100.0% |
| Range | 5.6% | 4.9% |
| Mean | 98.5% | 98.5% |
| Median | 98.5% | 98.5% |
| Interquartile 25% (IQ1) | 98.1% | 97.8% |
| Interquartile 75% (IQ3) | 99.1% | 99.7% |
| Interquartile Range (IQR) | 1.0% | 1.9% |
| Standard Deviation (Sample) | 1.0% | 1.2% |
| Standard Deviation (Population) | 1.0% | 1.1% |
Similar Demographics by 1st Grade
Demographics Similar to Thais by 1st Grade
In terms of 1st grade, the demographic groups most similar to Thais are Okinawan (98.1%, a difference of 0.0%), Yugoslavian (98.2%, a difference of 0.010%), Immigrants from France (98.2%, a difference of 0.010%), Immigrants from Zimbabwe (98.1%, a difference of 0.010%), and Menominee (98.1%, a difference of 0.010%).
| Demographics | Rating | Rank | 1st Grade |
| Immigrants | Norway | 96.6 /100 | #112 | Exceptional 98.2% |
| Immigrants | Latvia | 96.4 /100 | #113 | Exceptional 98.2% |
| Ute | 96.2 /100 | #114 | Exceptional 98.2% |
| Iranians | 96.0 /100 | #115 | Exceptional 98.2% |
| Spanish | 95.9 /100 | #116 | Exceptional 98.2% |
| Yugoslavians | 95.5 /100 | #117 | Exceptional 98.2% |
| Immigrants | France | 95.5 /100 | #118 | Exceptional 98.2% |
| Thais | 94.7 /100 | #119 | Exceptional 98.1% |
| Okinawans | 94.5 /100 | #120 | Exceptional 98.1% |
| Immigrants | Zimbabwe | 94.0 /100 | #121 | Exceptional 98.1% |
| Menominee | 93.9 /100 | #122 | Exceptional 98.1% |
| Iroquois | 93.8 /100 | #123 | Exceptional 98.1% |
| Syrians | 93.7 /100 | #124 | Exceptional 98.1% |
| Immigrants | Japan | 93.7 /100 | #125 | Exceptional 98.1% |
| Lebanese | 93.5 /100 | #126 | Exceptional 98.1% |
Demographics Similar to Immigrants from Argentina by 1st Grade
In terms of 1st grade, the demographic groups most similar to Immigrants from Argentina are Egyptian (97.9%, a difference of 0.0%), Immigrants from Poland (97.9%, a difference of 0.0%), Portuguese (97.9%, a difference of 0.010%), Immigrants from Belarus (97.9%, a difference of 0.010%), and Immigrants from Brazil (97.9%, a difference of 0.020%).
| Demographics | Rating | Rank | 1st Grade |
| Albanians | 49.6 /100 | #176 | Average 97.9% |
| Immigrants | Brazil | 49.1 /100 | #177 | Average 97.9% |
| Immigrants | Venezuela | 47.8 /100 | #178 | Average 97.9% |
| Argentineans | 47.2 /100 | #179 | Average 97.9% |
| Immigrants | Bosnia and Herzegovina | 46.6 /100 | #180 | Average 97.9% |
| Portuguese | 44.2 /100 | #181 | Average 97.9% |
| Egyptians | 42.7 /100 | #182 | Average 97.9% |
| Immigrants | Argentina | 41.3 /100 | #183 | Average 97.9% |
| Immigrants | Poland | 40.1 /100 | #184 | Average 97.9% |
| Immigrants | Belarus | 39.3 /100 | #185 | Fair 97.9% |
| Paiute | 36.5 /100 | #186 | Fair 97.9% |
| Pakistanis | 35.8 /100 | #187 | Fair 97.9% |
| Arabs | 35.5 /100 | #188 | Fair 97.9% |
| Immigrants | Kazakhstan | 34.9 /100 | #189 | Fair 97.9% |
| Panamanians | 34.1 /100 | #190 | Fair 97.9% |