Taiwanese vs Immigrants from Northern Africa 8th Grade
COMPARE
Taiwanese
Immigrants from Northern Africa
8th Grade
8th Grade Comparison
Taiwanese
Immigrants from Northern Africa
94.7%
8TH GRADE
0.1/ 100
METRIC RATING
277th/ 347
METRIC RANK
95.5%
8TH GRADE
22.5/ 100
METRIC RATING
199th/ 347
METRIC RANK
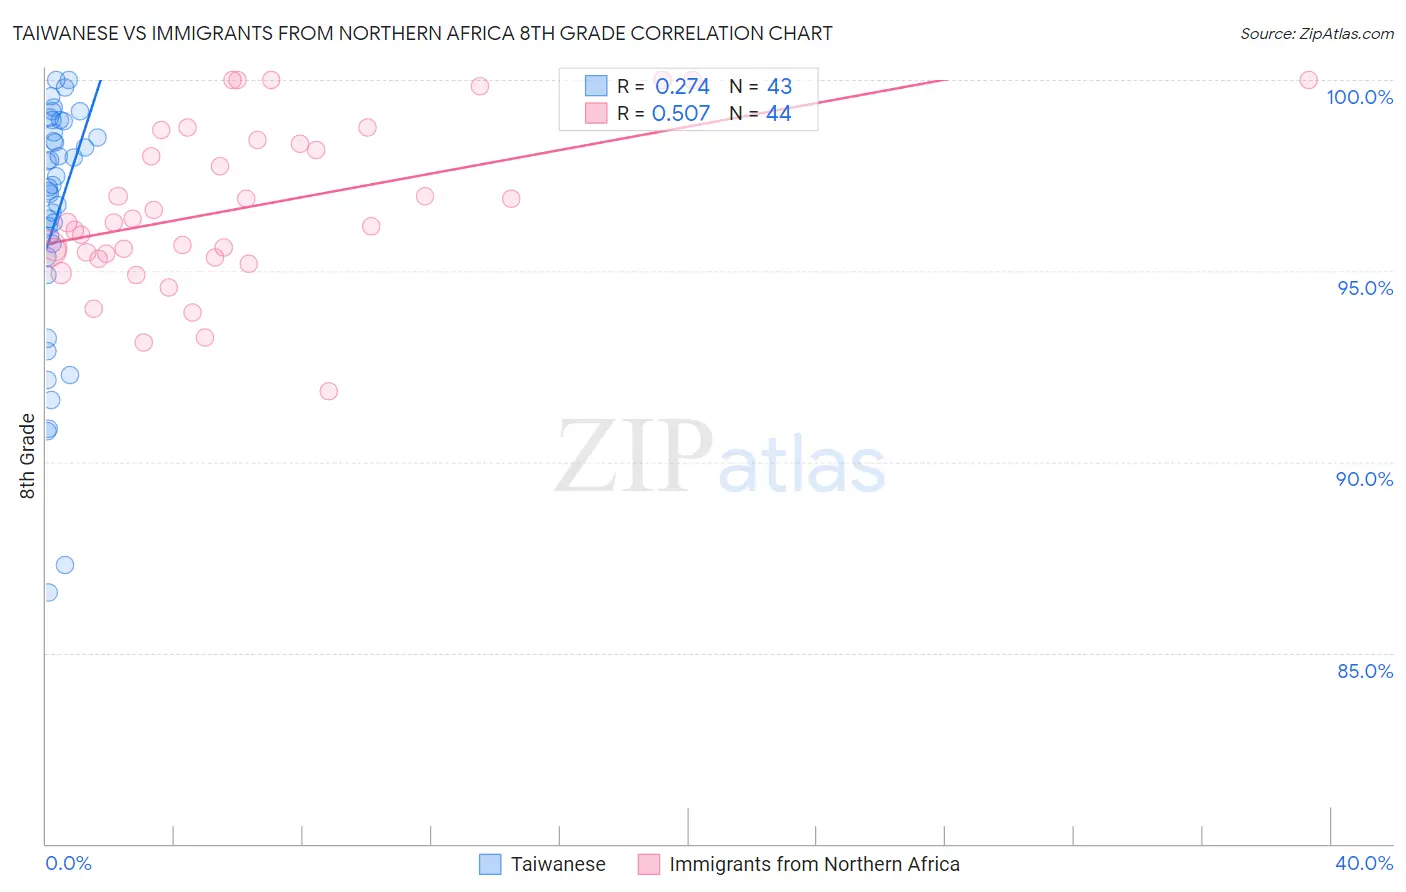
Taiwanese vs Immigrants from Northern Africa 8th Grade Correlation Chart
The statistical analysis conducted on geographies consisting of 31,677,387 people shows a weak positive correlation between the proportion of Taiwanese and percentage of population with at least 8th grade education in the United States with a correlation coefficient (R) of 0.274 and weighted average of 94.7%. Similarly, the statistical analysis conducted on geographies consisting of 321,196,768 people shows a substantial positive correlation between the proportion of Immigrants from Northern Africa and percentage of population with at least 8th grade education in the United States with a correlation coefficient (R) of 0.507 and weighted average of 95.5%, a difference of 0.91%.
8th Grade Correlation Summary
| Measurement | Taiwanese | Immigrants from Northern Africa |
| Minimum | 86.6% | 91.9% |
| Maximum | 100.0% | 100.0% |
| Range | 13.4% | 8.1% |
| Mean | 96.4% | 96.7% |
| Median | 97.3% | 96.3% |
| Interquartile 25% (IQ1) | 95.4% | 95.4% |
| Interquartile 75% (IQ3) | 98.9% | 98.4% |
| Interquartile Range (IQR) | 3.5% | 3.0% |
| Standard Deviation (Sample) | 3.3% | 2.1% |
| Standard Deviation (Population) | 3.3% | 2.1% |
Similar Demographics by 8th Grade
Demographics Similar to Taiwanese by 8th Grade
In terms of 8th grade, the demographic groups most similar to Taiwanese are Peruvian (94.7%, a difference of 0.030%), Armenian (94.7%, a difference of 0.030%), Immigrants from Trinidad and Tobago (94.6%, a difference of 0.040%), Barbadian (94.6%, a difference of 0.040%), and Immigrants from Bolivia (94.6%, a difference of 0.040%).
| Demographics | Rating | Rank | 8th Grade |
| Immigrants | Uzbekistan | 0.2 /100 | #270 | Tragic 94.8% |
| Immigrants | Afghanistan | 0.2 /100 | #271 | Tragic 94.8% |
| Immigrants | South America | 0.2 /100 | #272 | Tragic 94.8% |
| Immigrants | Western Africa | 0.2 /100 | #273 | Tragic 94.8% |
| Trinidadians and Tobagonians | 0.2 /100 | #274 | Tragic 94.7% |
| Immigrants | Colombia | 0.2 /100 | #275 | Tragic 94.7% |
| Peruvians | 0.1 /100 | #276 | Tragic 94.7% |
| Taiwanese | 0.1 /100 | #277 | Tragic 94.7% |
| Armenians | 0.1 /100 | #278 | Tragic 94.7% |
| Immigrants | Trinidad and Tobago | 0.1 /100 | #279 | Tragic 94.6% |
| Barbadians | 0.1 /100 | #280 | Tragic 94.6% |
| Immigrants | Bolivia | 0.1 /100 | #281 | Tragic 94.6% |
| Immigrants | Eritrea | 0.1 /100 | #282 | Tragic 94.6% |
| Immigrants | St. Vincent and the Grenadines | 0.1 /100 | #283 | Tragic 94.6% |
| Immigrants | Philippines | 0.1 /100 | #284 | Tragic 94.6% |
Demographics Similar to Immigrants from Northern Africa by 8th Grade
In terms of 8th grade, the demographic groups most similar to Immigrants from Northern Africa are Paraguayan (95.5%, a difference of 0.0%), Argentinean (95.5%, a difference of 0.0%), Immigrants from Zaire (95.6%, a difference of 0.020%), Assyrian/Chaldean/Syriac (95.6%, a difference of 0.020%), and Sierra Leonean (95.6%, a difference of 0.020%).
| Demographics | Rating | Rank | 8th Grade |
| Pima | 28.6 /100 | #192 | Fair 95.6% |
| Panamanians | 28.4 /100 | #193 | Fair 95.6% |
| Guamanians/Chamorros | 26.6 /100 | #194 | Fair 95.6% |
| Immigrants | Zaire | 25.2 /100 | #195 | Fair 95.6% |
| Assyrians/Chaldeans/Syriacs | 24.5 /100 | #196 | Fair 95.6% |
| Sierra Leoneans | 24.3 /100 | #197 | Fair 95.6% |
| Paraguayans | 22.6 /100 | #198 | Fair 95.5% |
| Immigrants | Northern Africa | 22.5 /100 | #199 | Fair 95.5% |
| Argentineans | 22.2 /100 | #200 | Fair 95.5% |
| Immigrants | Argentina | 20.6 /100 | #201 | Fair 95.5% |
| Apache | 19.4 /100 | #202 | Poor 95.5% |
| Moroccans | 17.4 /100 | #203 | Poor 95.5% |
| Hawaiians | 16.7 /100 | #204 | Poor 95.5% |
| Immigrants | Bahamas | 16.7 /100 | #205 | Poor 95.5% |
| Comanche | 16.3 /100 | #206 | Poor 95.5% |