Taiwanese vs Hispanic or Latino 8th Grade
COMPARE
Taiwanese
Hispanic or Latino
8th Grade
8th Grade Comparison
Taiwanese
Hispanics or Latinos
94.7%
8TH GRADE
0.1/ 100
METRIC RATING
277th/ 347
METRIC RANK
92.2%
8TH GRADE
0.0/ 100
METRIC RATING
333rd/ 347
METRIC RANK
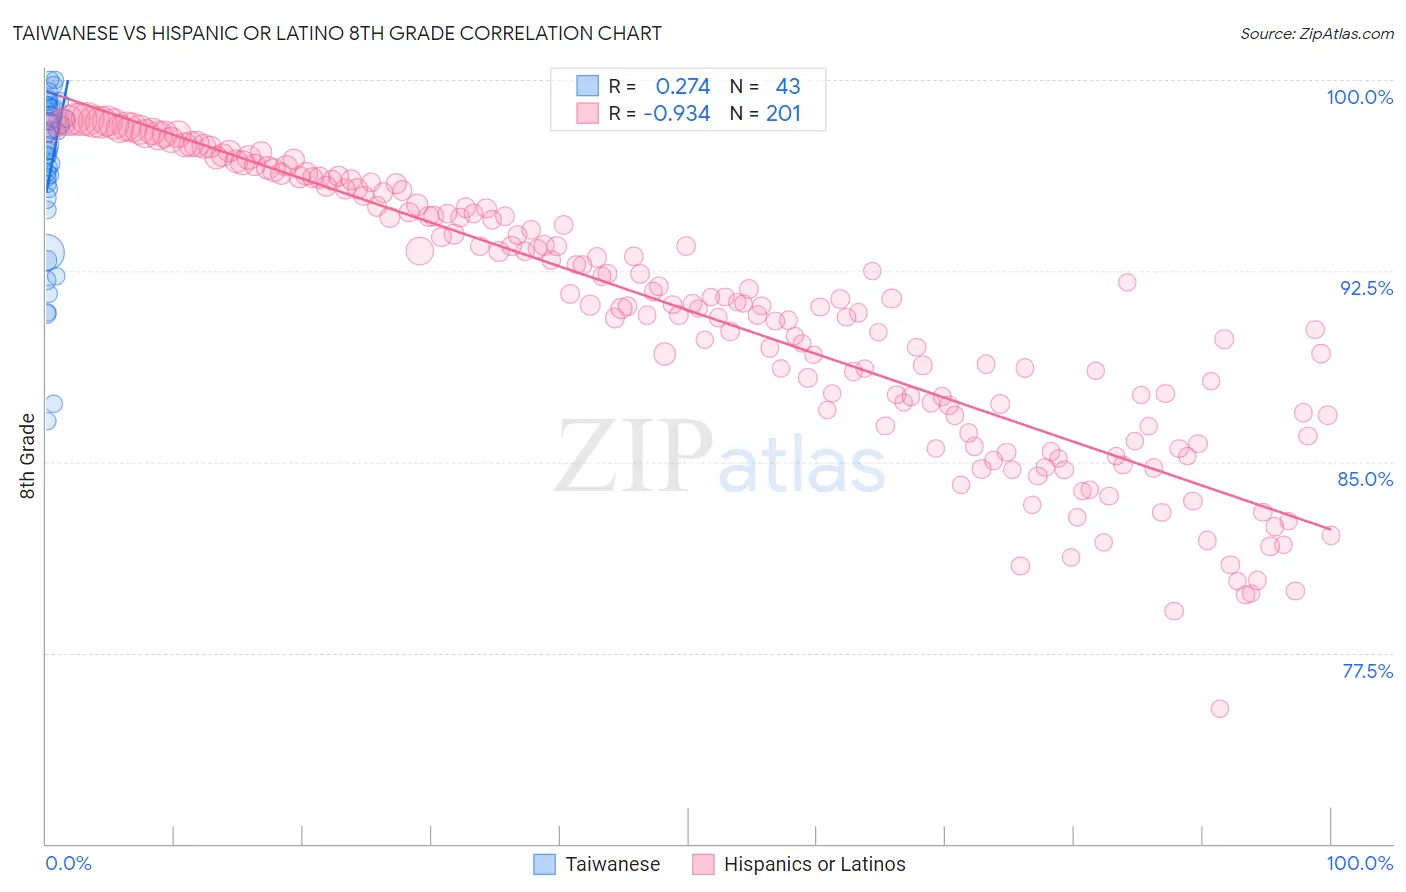
Taiwanese vs Hispanic or Latino 8th Grade Correlation Chart
The statistical analysis conducted on geographies consisting of 31,677,387 people shows a weak positive correlation between the proportion of Taiwanese and percentage of population with at least 8th grade education in the United States with a correlation coefficient (R) of 0.274 and weighted average of 94.7%. Similarly, the statistical analysis conducted on geographies consisting of 578,614,481 people shows a near-perfect negative correlation between the proportion of Hispanics or Latinos and percentage of population with at least 8th grade education in the United States with a correlation coefficient (R) of -0.934 and weighted average of 92.2%, a difference of 2.7%.
8th Grade Correlation Summary
| Measurement | Taiwanese | Hispanic or Latino |
| Minimum | 86.6% | 75.3% |
| Maximum | 100.0% | 98.5% |
| Range | 13.4% | 23.2% |
| Mean | 96.4% | 90.9% |
| Median | 97.3% | 91.2% |
| Interquartile 25% (IQ1) | 95.4% | 86.9% |
| Interquartile 75% (IQ3) | 98.9% | 95.7% |
| Interquartile Range (IQR) | 3.5% | 8.9% |
| Standard Deviation (Sample) | 3.3% | 5.4% |
| Standard Deviation (Population) | 3.3% | 5.3% |
Similar Demographics by 8th Grade
Demographics Similar to Taiwanese by 8th Grade
In terms of 8th grade, the demographic groups most similar to Taiwanese are Peruvian (94.7%, a difference of 0.030%), Armenian (94.7%, a difference of 0.030%), Immigrants from Trinidad and Tobago (94.6%, a difference of 0.040%), Barbadian (94.6%, a difference of 0.040%), and Immigrants from Bolivia (94.6%, a difference of 0.040%).
| Demographics | Rating | Rank | 8th Grade |
| Immigrants | Uzbekistan | 0.2 /100 | #270 | Tragic 94.8% |
| Immigrants | Afghanistan | 0.2 /100 | #271 | Tragic 94.8% |
| Immigrants | South America | 0.2 /100 | #272 | Tragic 94.8% |
| Immigrants | Western Africa | 0.2 /100 | #273 | Tragic 94.8% |
| Trinidadians and Tobagonians | 0.2 /100 | #274 | Tragic 94.7% |
| Immigrants | Colombia | 0.2 /100 | #275 | Tragic 94.7% |
| Peruvians | 0.1 /100 | #276 | Tragic 94.7% |
| Taiwanese | 0.1 /100 | #277 | Tragic 94.7% |
| Armenians | 0.1 /100 | #278 | Tragic 94.7% |
| Immigrants | Trinidad and Tobago | 0.1 /100 | #279 | Tragic 94.6% |
| Barbadians | 0.1 /100 | #280 | Tragic 94.6% |
| Immigrants | Bolivia | 0.1 /100 | #281 | Tragic 94.6% |
| Immigrants | Eritrea | 0.1 /100 | #282 | Tragic 94.6% |
| Immigrants | St. Vincent and the Grenadines | 0.1 /100 | #283 | Tragic 94.6% |
| Immigrants | Philippines | 0.1 /100 | #284 | Tragic 94.6% |
Demographics Similar to Hispanics or Latinos by 8th Grade
In terms of 8th grade, the demographic groups most similar to Hispanics or Latinos are Immigrants from Yemen (92.1%, a difference of 0.060%), Immigrants from Dominican Republic (92.3%, a difference of 0.11%), Mexican American Indian (92.1%, a difference of 0.11%), Honduran (92.3%, a difference of 0.13%), and Immigrants from Armenia (92.3%, a difference of 0.14%).
| Demographics | Rating | Rank | 8th Grade |
| Central American Indians | 0.0 /100 | #326 | Tragic 92.7% |
| Immigrants | Azores | 0.0 /100 | #327 | Tragic 92.5% |
| Immigrants | Nicaragua | 0.0 /100 | #328 | Tragic 92.5% |
| Immigrants | Cabo Verde | 0.0 /100 | #329 | Tragic 92.4% |
| Immigrants | Armenia | 0.0 /100 | #330 | Tragic 92.3% |
| Hondurans | 0.0 /100 | #331 | Tragic 92.3% |
| Immigrants | Dominican Republic | 0.0 /100 | #332 | Tragic 92.3% |
| Hispanics or Latinos | 0.0 /100 | #333 | Tragic 92.2% |
| Immigrants | Yemen | 0.0 /100 | #334 | Tragic 92.1% |
| Mexican American Indians | 0.0 /100 | #335 | Tragic 92.1% |
| Immigrants | Honduras | 0.0 /100 | #336 | Tragic 91.9% |
| Immigrants | Latin America | 0.0 /100 | #337 | Tragic 91.7% |
| Central Americans | 0.0 /100 | #338 | Tragic 91.6% |
| Mexicans | 0.0 /100 | #339 | Tragic 91.4% |
| Yakama | 0.0 /100 | #340 | Tragic 91.2% |