South American vs Immigrants from Trinidad and Tobago High School Diploma
COMPARE
South American
Immigrants from Trinidad and Tobago
High School Diploma
High School Diploma Comparison
South Americans
Immigrants from Trinidad and Tobago
87.9%
HIGH SCHOOL DIPLOMA
2.7/ 100
METRIC RATING
239th/ 347
METRIC RANK
86.8%
HIGH SCHOOL DIPLOMA
0.1/ 100
METRIC RATING
275th/ 347
METRIC RANK
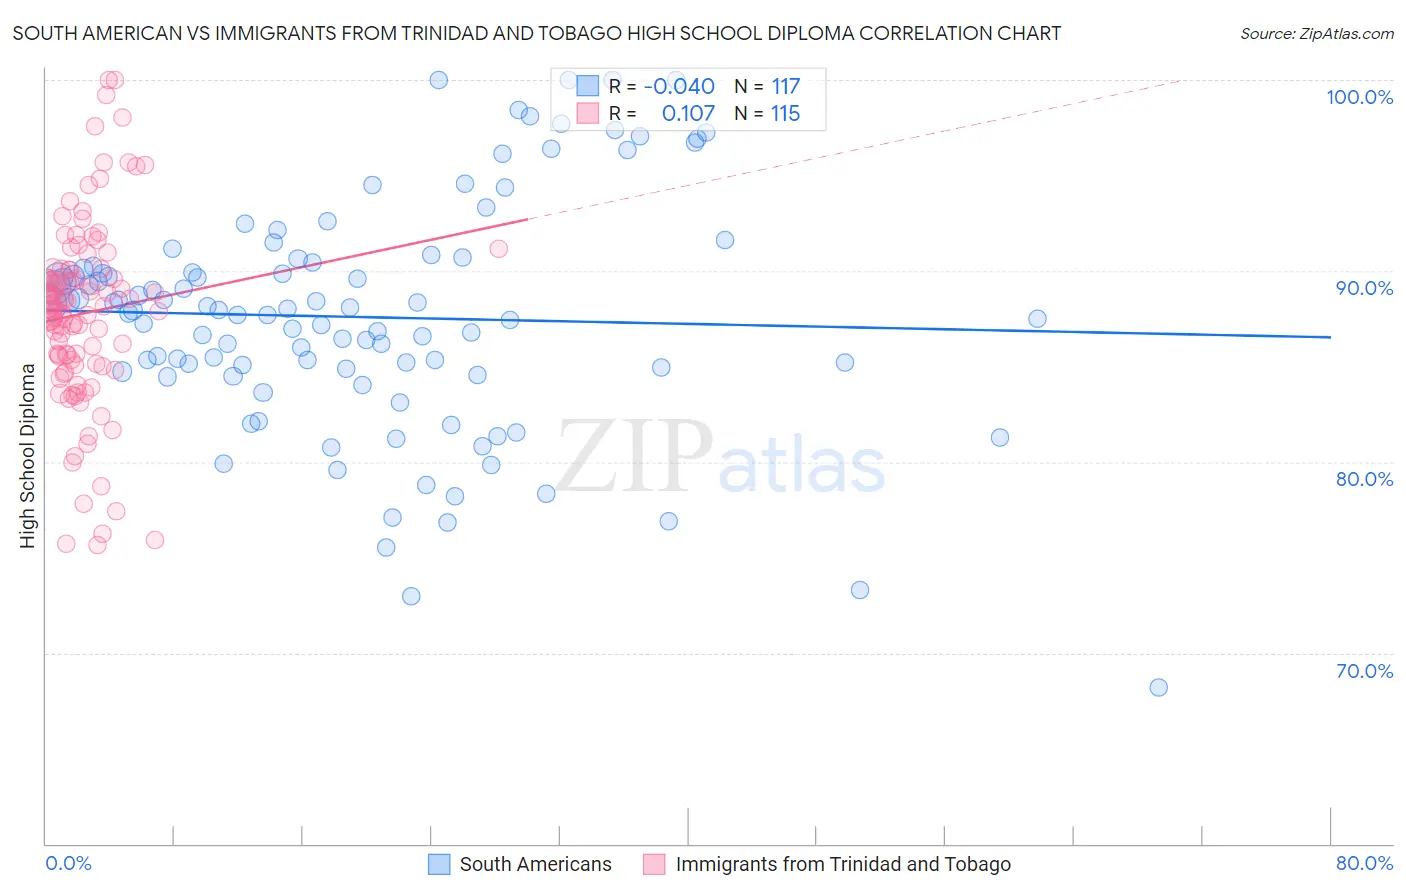
South American vs Immigrants from Trinidad and Tobago High School Diploma Correlation Chart
The statistical analysis conducted on geographies consisting of 494,065,729 people shows no correlation between the proportion of South Americans and percentage of population with at least high school diploma education in the United States with a correlation coefficient (R) of -0.040 and weighted average of 87.9%. Similarly, the statistical analysis conducted on geographies consisting of 223,527,464 people shows a poor positive correlation between the proportion of Immigrants from Trinidad and Tobago and percentage of population with at least high school diploma education in the United States with a correlation coefficient (R) of 0.107 and weighted average of 86.8%, a difference of 1.4%.
High School Diploma Correlation Summary
| Measurement | South American | Immigrants from Trinidad and Tobago |
| Minimum | 68.2% | 75.6% |
| Maximum | 100.0% | 100.0% |
| Range | 31.8% | 24.4% |
| Mean | 87.6% | 87.8% |
| Median | 87.9% | 88.1% |
| Interquartile 25% (IQ1) | 84.8% | 85.1% |
| Interquartile 75% (IQ3) | 90.3% | 90.1% |
| Interquartile Range (IQR) | 5.5% | 4.9% |
| Standard Deviation (Sample) | 6.1% | 4.9% |
| Standard Deviation (Population) | 6.0% | 4.8% |
Similar Demographics by High School Diploma
Demographics Similar to South Americans by High School Diploma
In terms of high school diploma, the demographic groups most similar to South Americans are Taiwanese (87.9%, a difference of 0.0%), Sioux (87.9%, a difference of 0.0%), Subsaharan African (87.9%, a difference of 0.010%), Immigrants from Bahamas (88.0%, a difference of 0.030%), and Immigrants from Panama (88.0%, a difference of 0.050%).
| Demographics | Rating | Rank | High School Diploma |
| Immigrants | Middle Africa | 3.4 /100 | #232 | Tragic 88.0% |
| Immigrants | Panama | 3.1 /100 | #233 | Tragic 88.0% |
| Immigrants | Thailand | 3.1 /100 | #234 | Tragic 88.0% |
| Immigrants | Bahamas | 2.9 /100 | #235 | Tragic 88.0% |
| Sub-Saharan Africans | 2.8 /100 | #236 | Tragic 87.9% |
| Taiwanese | 2.8 /100 | #237 | Tragic 87.9% |
| Sioux | 2.7 /100 | #238 | Tragic 87.9% |
| South Americans | 2.7 /100 | #239 | Tragic 87.9% |
| Comanche | 2.2 /100 | #240 | Tragic 87.9% |
| Immigrants | Uzbekistan | 2.1 /100 | #241 | Tragic 87.8% |
| Cheyenne | 2.1 /100 | #242 | Tragic 87.8% |
| Immigrants | Philippines | 1.9 /100 | #243 | Tragic 87.8% |
| Choctaw | 1.9 /100 | #244 | Tragic 87.8% |
| Peruvians | 1.9 /100 | #245 | Tragic 87.8% |
| Immigrants | Eritrea | 1.7 /100 | #246 | Tragic 87.8% |
Demographics Similar to Immigrants from Trinidad and Tobago by High School Diploma
In terms of high school diploma, the demographic groups most similar to Immigrants from Trinidad and Tobago are Immigrants from Burma/Myanmar (86.7%, a difference of 0.070%), Barbadian (86.7%, a difference of 0.080%), Bangladeshi (86.9%, a difference of 0.14%), Immigrants from Jamaica (86.9%, a difference of 0.15%), and West Indian (86.9%, a difference of 0.19%).
| Demographics | Rating | Rank | High School Diploma |
| Pennsylvania Germans | 0.2 /100 | #268 | Tragic 87.0% |
| Sri Lankans | 0.2 /100 | #269 | Tragic 87.0% |
| Malaysians | 0.2 /100 | #270 | Tragic 87.0% |
| West Indians | 0.1 /100 | #271 | Tragic 86.9% |
| Trinidadians and Tobagonians | 0.1 /100 | #272 | Tragic 86.9% |
| Immigrants | Jamaica | 0.1 /100 | #273 | Tragic 86.9% |
| Bangladeshis | 0.1 /100 | #274 | Tragic 86.9% |
| Immigrants | Trinidad and Tobago | 0.1 /100 | #275 | Tragic 86.8% |
| Immigrants | Burma/Myanmar | 0.1 /100 | #276 | Tragic 86.7% |
| Barbadians | 0.1 /100 | #277 | Tragic 86.7% |
| Hopi | 0.1 /100 | #278 | Tragic 86.6% |
| Immigrants | Laos | 0.0 /100 | #279 | Tragic 86.6% |
| Pueblo | 0.0 /100 | #280 | Tragic 86.5% |
| Indonesians | 0.0 /100 | #281 | Tragic 86.5% |
| Dutch West Indians | 0.0 /100 | #282 | Tragic 86.5% |