South American vs Immigrants from Peru No Schooling Completed
COMPARE
South American
Immigrants from Peru
No Schooling Completed
No Schooling Completed Comparison
South Americans
Immigrants from Peru
2.4%
NO SCHOOLING COMPLETED
1.5/ 100
METRIC RATING
243rd/ 347
METRIC RANK
2.5%
NO SCHOOLING COMPLETED
0.2/ 100
METRIC RATING
270th/ 347
METRIC RANK
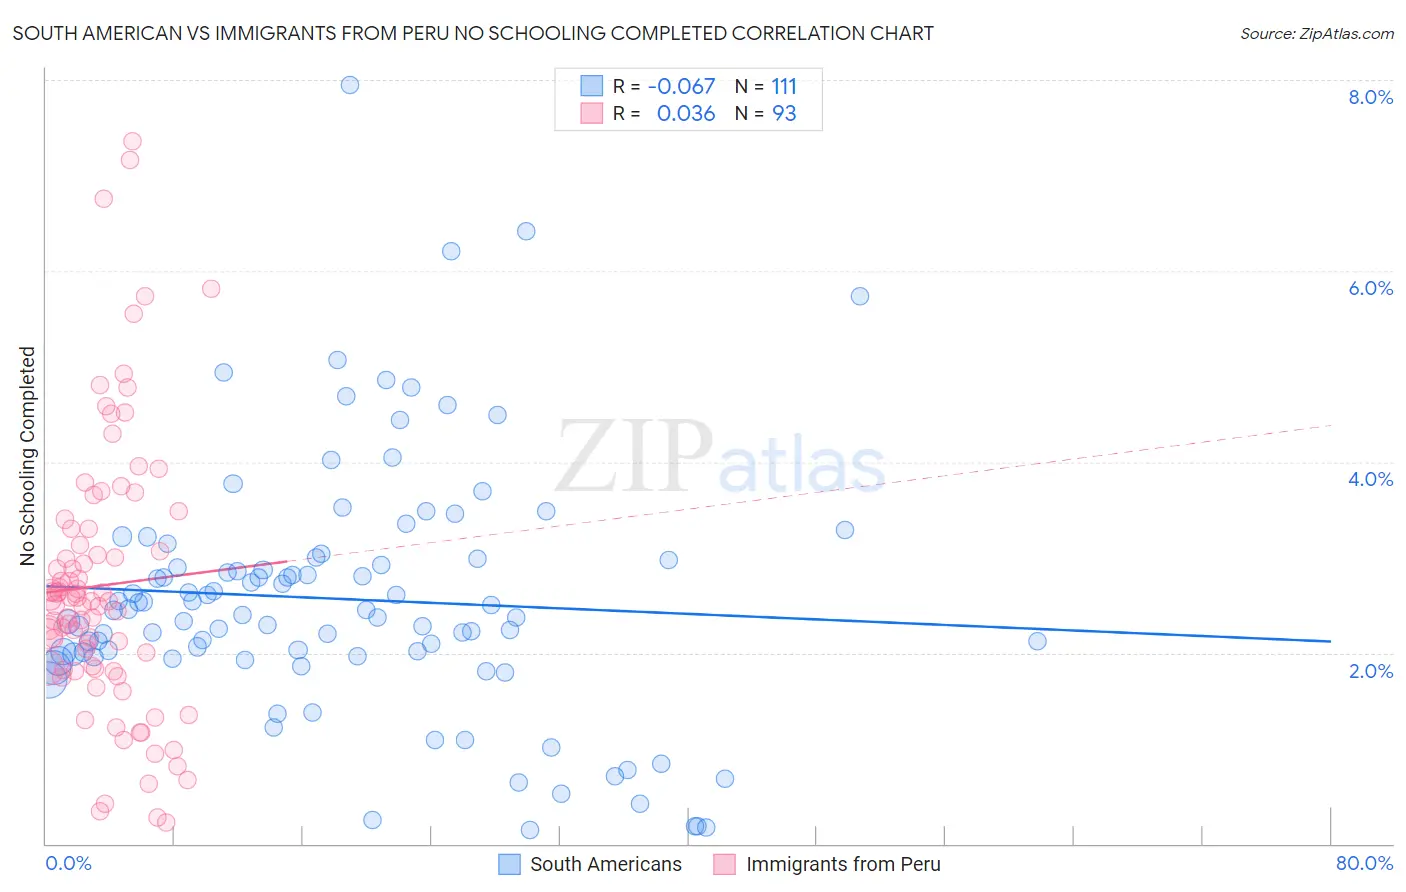
South American vs Immigrants from Peru No Schooling Completed Correlation Chart
The statistical analysis conducted on geographies consisting of 486,388,678 people shows a slight negative correlation between the proportion of South Americans and percentage of population with no schooling in the United States with a correlation coefficient (R) of -0.067 and weighted average of 2.4%. Similarly, the statistical analysis conducted on geographies consisting of 326,728,485 people shows no correlation between the proportion of Immigrants from Peru and percentage of population with no schooling in the United States with a correlation coefficient (R) of 0.036 and weighted average of 2.5%, a difference of 5.4%.
No Schooling Completed Correlation Summary
| Measurement | South American | Immigrants from Peru |
| Minimum | 0.14% | 0.23% |
| Maximum | 7.9% | 7.4% |
| Range | 7.8% | 7.1% |
| Mean | 2.6% | 2.7% |
| Median | 2.4% | 2.5% |
| Interquartile 25% (IQ1) | 2.0% | 1.8% |
| Interquartile 75% (IQ3) | 3.0% | 3.3% |
| Interquartile Range (IQR) | 1.0% | 1.5% |
| Standard Deviation (Sample) | 1.3% | 1.4% |
| Standard Deviation (Population) | 1.3% | 1.4% |
Similar Demographics by No Schooling Completed
Demographics Similar to South Americans by No Schooling Completed
In terms of no schooling completed, the demographic groups most similar to South Americans are Immigrants from Indonesia (2.4%, a difference of 0.040%), Peruvian (2.4%, a difference of 0.11%), Bolivian (2.4%, a difference of 0.11%), Immigrants from Congo (2.4%, a difference of 0.16%), and Immigrants from Iraq (2.4%, a difference of 0.27%).
| Demographics | Rating | Rank | No Schooling Completed |
| Iraqis | 2.2 /100 | #236 | Tragic 2.4% |
| Immigrants | Eastern Asia | 2.0 /100 | #237 | Tragic 2.4% |
| Paiute | 1.9 /100 | #238 | Tragic 2.4% |
| Liberians | 1.8 /100 | #239 | Tragic 2.4% |
| Immigrants | Senegal | 1.7 /100 | #240 | Tragic 2.4% |
| Koreans | 1.7 /100 | #241 | Tragic 2.4% |
| Immigrants | Indonesia | 1.5 /100 | #242 | Tragic 2.4% |
| South Americans | 1.5 /100 | #243 | Tragic 2.4% |
| Peruvians | 1.4 /100 | #244 | Tragic 2.4% |
| Bolivians | 1.4 /100 | #245 | Tragic 2.4% |
| Immigrants | Congo | 1.4 /100 | #246 | Tragic 2.4% |
| Immigrants | Iraq | 1.3 /100 | #247 | Tragic 2.4% |
| Asians | 1.2 /100 | #248 | Tragic 2.4% |
| Jamaicans | 1.2 /100 | #249 | Tragic 2.4% |
| Immigrants | Middle Africa | 1.1 /100 | #250 | Tragic 2.4% |
Demographics Similar to Immigrants from Peru by No Schooling Completed
In terms of no schooling completed, the demographic groups most similar to Immigrants from Peru are Cuban (2.5%, a difference of 0.010%), Immigrants from Nigeria (2.5%, a difference of 0.080%), Immigrants from Bolivia (2.5%, a difference of 0.54%), Taiwanese (2.5%, a difference of 0.94%), and Yuman (2.5%, a difference of 1.2%).
| Demographics | Rating | Rank | No Schooling Completed |
| Immigrants | Liberia | 0.4 /100 | #263 | Tragic 2.5% |
| Indians (Asian) | 0.4 /100 | #264 | Tragic 2.5% |
| West Indians | 0.4 /100 | #265 | Tragic 2.5% |
| Fijians | 0.4 /100 | #266 | Tragic 2.5% |
| Yuman | 0.4 /100 | #267 | Tragic 2.5% |
| Taiwanese | 0.3 /100 | #268 | Tragic 2.5% |
| Immigrants | Nigeria | 0.2 /100 | #269 | Tragic 2.5% |
| Immigrants | Peru | 0.2 /100 | #270 | Tragic 2.5% |
| Cubans | 0.2 /100 | #271 | Tragic 2.5% |
| Immigrants | Bolivia | 0.2 /100 | #272 | Tragic 2.5% |
| Immigrants | Cameroon | 0.1 /100 | #273 | Tragic 2.5% |
| Ghanaians | 0.1 /100 | #274 | Tragic 2.6% |
| Immigrants | China | 0.1 /100 | #275 | Tragic 2.6% |
| Immigrants | Western Africa | 0.1 /100 | #276 | Tragic 2.6% |
| Immigrants | Philippines | 0.1 /100 | #277 | Tragic 2.6% |