Portuguese vs Immigrants from Peru No Schooling Completed
COMPARE
Portuguese
Immigrants from Peru
No Schooling Completed
No Schooling Completed Comparison
Portuguese
Immigrants from Peru
2.1%
NO SCHOOLING COMPLETED
43.9/ 100
METRIC RATING
180th/ 347
METRIC RANK
2.5%
NO SCHOOLING COMPLETED
0.2/ 100
METRIC RATING
270th/ 347
METRIC RANK
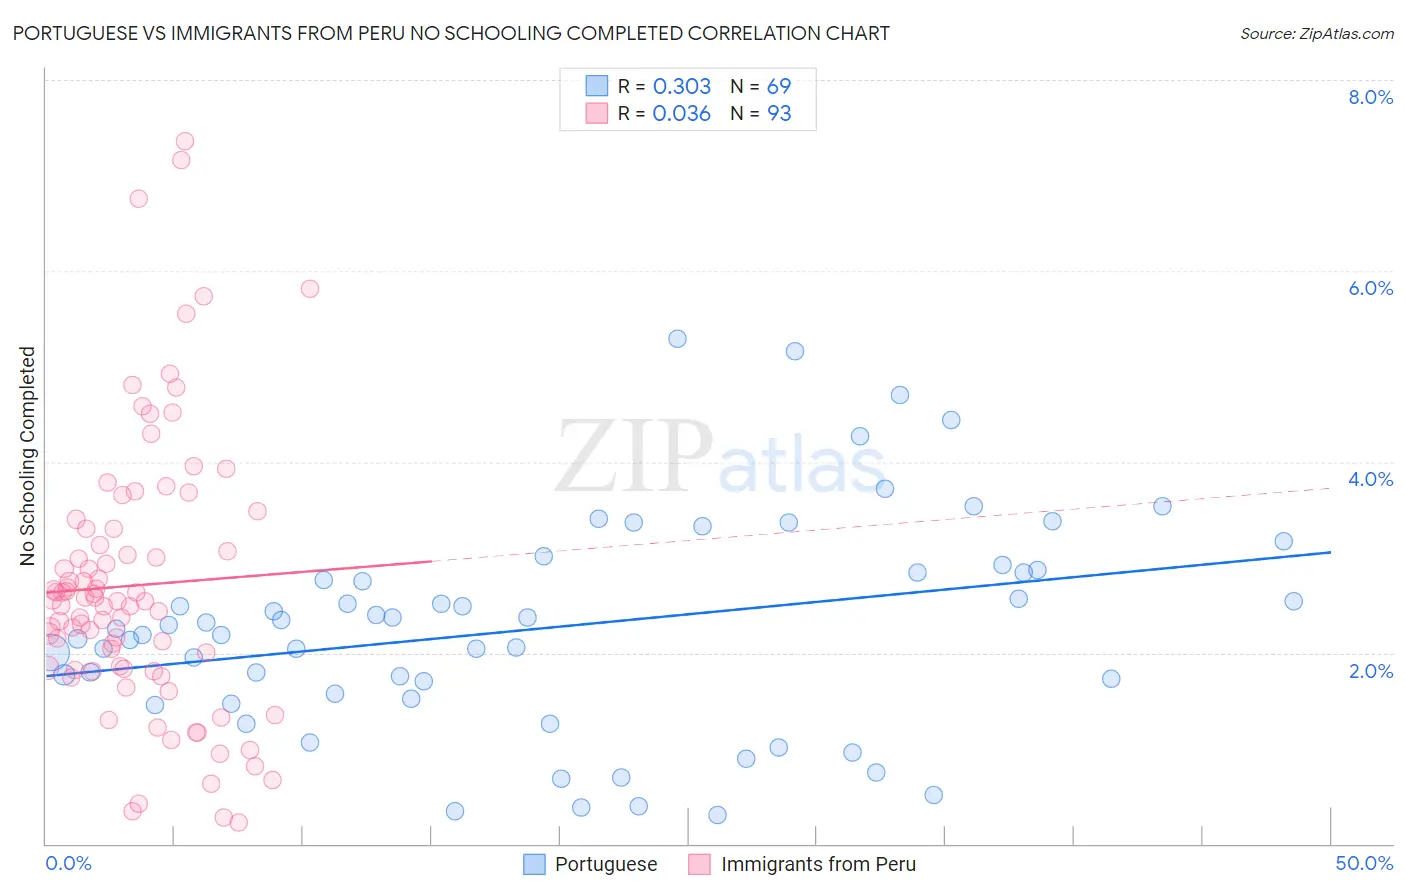
Portuguese vs Immigrants from Peru No Schooling Completed Correlation Chart
The statistical analysis conducted on geographies consisting of 443,195,233 people shows a mild positive correlation between the proportion of Portuguese and percentage of population with no schooling in the United States with a correlation coefficient (R) of 0.303 and weighted average of 2.1%. Similarly, the statistical analysis conducted on geographies consisting of 326,728,485 people shows no correlation between the proportion of Immigrants from Peru and percentage of population with no schooling in the United States with a correlation coefficient (R) of 0.036 and weighted average of 2.5%, a difference of 19.3%.
No Schooling Completed Correlation Summary
| Measurement | Portuguese | Immigrants from Peru |
| Minimum | 0.30% | 0.23% |
| Maximum | 5.3% | 7.4% |
| Range | 5.0% | 7.1% |
| Mean | 2.3% | 2.7% |
| Median | 2.3% | 2.5% |
| Interquartile 25% (IQ1) | 1.5% | 1.8% |
| Interquartile 75% (IQ3) | 2.9% | 3.3% |
| Interquartile Range (IQR) | 1.3% | 1.5% |
| Standard Deviation (Sample) | 1.1% | 1.4% |
| Standard Deviation (Population) | 1.1% | 1.4% |
Similar Demographics by No Schooling Completed
Demographics Similar to Portuguese by No Schooling Completed
In terms of no schooling completed, the demographic groups most similar to Portuguese are Immigrants from Kazakhstan (2.1%, a difference of 0.060%), Pakistani (2.1%, a difference of 0.11%), Arapaho (2.1%, a difference of 0.16%), Panamanian (2.1%, a difference of 0.17%), and Immigrants from Taiwan (2.1%, a difference of 0.18%).
| Demographics | Rating | Rank | No Schooling Completed |
| Immigrants | Belarus | 51.8 /100 | #173 | Average 2.1% |
| Immigrants | Micronesia | 50.0 /100 | #174 | Average 2.1% |
| Arabs | 46.4 /100 | #175 | Average 2.1% |
| Panamanians | 45.2 /100 | #176 | Average 2.1% |
| Arapaho | 45.0 /100 | #177 | Average 2.1% |
| Pakistanis | 44.7 /100 | #178 | Average 2.1% |
| Immigrants | Kazakhstan | 44.3 /100 | #179 | Average 2.1% |
| Portuguese | 43.9 /100 | #180 | Average 2.1% |
| Immigrants | Taiwan | 42.6 /100 | #181 | Average 2.1% |
| French American Indians | 42.2 /100 | #182 | Average 2.1% |
| Blacks/African Americans | 41.4 /100 | #183 | Average 2.1% |
| Pima | 41.3 /100 | #184 | Average 2.1% |
| Mongolians | 40.8 /100 | #185 | Average 2.1% |
| Immigrants | Bosnia and Herzegovina | 38.6 /100 | #186 | Fair 2.1% |
| Navajo | 36.5 /100 | #187 | Fair 2.1% |
Demographics Similar to Immigrants from Peru by No Schooling Completed
In terms of no schooling completed, the demographic groups most similar to Immigrants from Peru are Cuban (2.5%, a difference of 0.010%), Immigrants from Nigeria (2.5%, a difference of 0.080%), Immigrants from Bolivia (2.5%, a difference of 0.54%), Taiwanese (2.5%, a difference of 0.94%), and Yuman (2.5%, a difference of 1.2%).
| Demographics | Rating | Rank | No Schooling Completed |
| Immigrants | Liberia | 0.4 /100 | #263 | Tragic 2.5% |
| Indians (Asian) | 0.4 /100 | #264 | Tragic 2.5% |
| West Indians | 0.4 /100 | #265 | Tragic 2.5% |
| Fijians | 0.4 /100 | #266 | Tragic 2.5% |
| Yuman | 0.4 /100 | #267 | Tragic 2.5% |
| Taiwanese | 0.3 /100 | #268 | Tragic 2.5% |
| Immigrants | Nigeria | 0.2 /100 | #269 | Tragic 2.5% |
| Immigrants | Peru | 0.2 /100 | #270 | Tragic 2.5% |
| Cubans | 0.2 /100 | #271 | Tragic 2.5% |
| Immigrants | Bolivia | 0.2 /100 | #272 | Tragic 2.5% |
| Immigrants | Cameroon | 0.1 /100 | #273 | Tragic 2.5% |
| Ghanaians | 0.1 /100 | #274 | Tragic 2.6% |
| Immigrants | China | 0.1 /100 | #275 | Tragic 2.6% |
| Immigrants | Western Africa | 0.1 /100 | #276 | Tragic 2.6% |
| Immigrants | Philippines | 0.1 /100 | #277 | Tragic 2.6% |