South American vs Immigrants from India 8th Grade
COMPARE
South American
Immigrants from India
8th Grade
8th Grade Comparison
South Americans
Immigrants from India
94.9%
8TH GRADE
0.4/ 100
METRIC RATING
264th/ 347
METRIC RANK
96.6%
8TH GRADE
99.7/ 100
METRIC RATING
64th/ 347
METRIC RANK
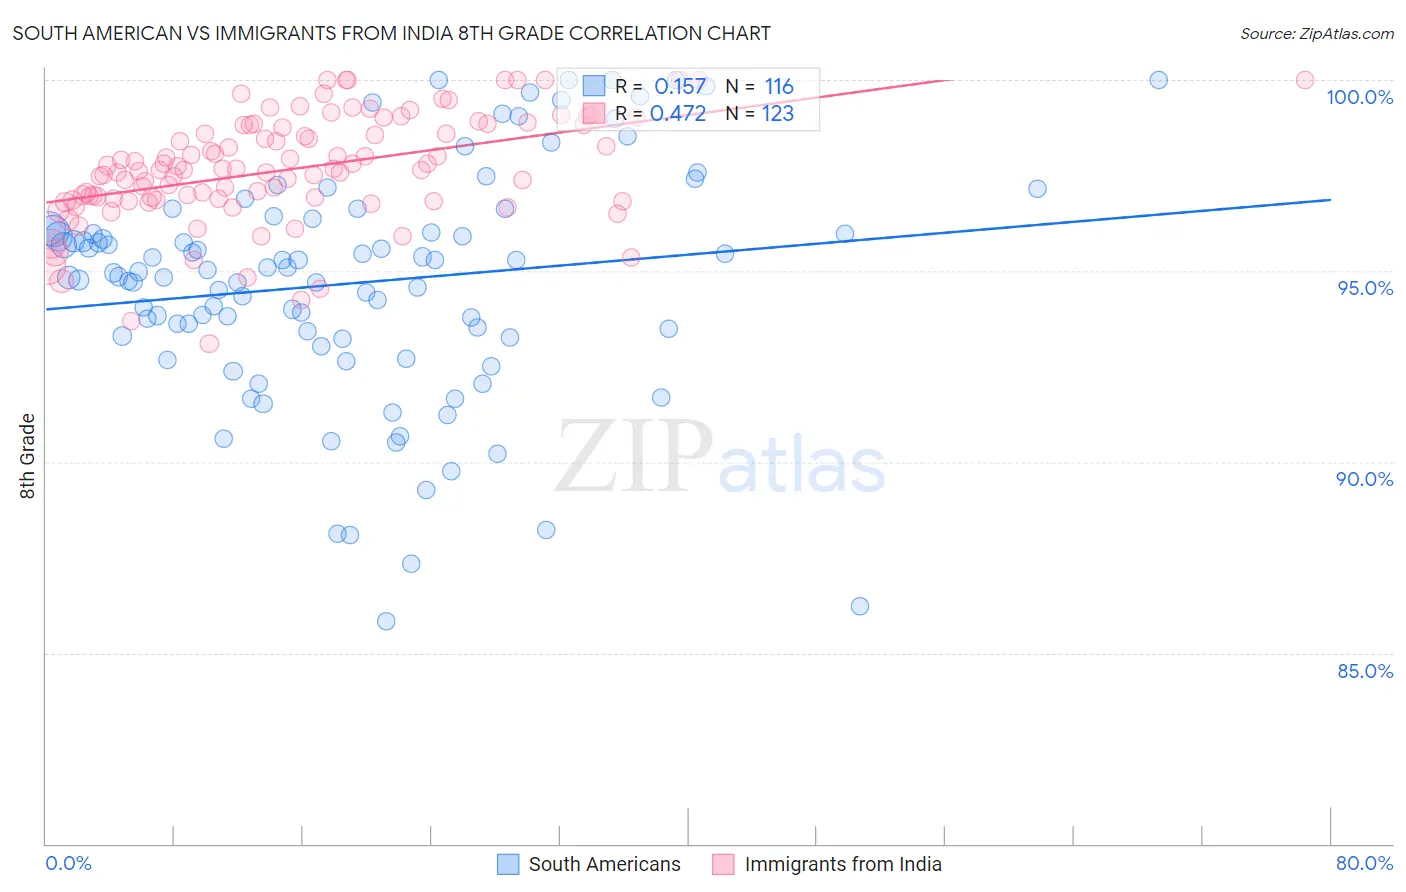
South American vs Immigrants from India 8th Grade Correlation Chart
The statistical analysis conducted on geographies consisting of 494,065,697 people shows a poor positive correlation between the proportion of South Americans and percentage of population with at least 8th grade education in the United States with a correlation coefficient (R) of 0.157 and weighted average of 94.9%. Similarly, the statistical analysis conducted on geographies consisting of 434,105,844 people shows a moderate positive correlation between the proportion of Immigrants from India and percentage of population with at least 8th grade education in the United States with a correlation coefficient (R) of 0.472 and weighted average of 96.6%, a difference of 1.9%.
8th Grade Correlation Summary
| Measurement | South American | Immigrants from India |
| Minimum | 85.8% | 93.1% |
| Maximum | 100.0% | 100.0% |
| Range | 14.2% | 6.9% |
| Mean | 94.7% | 97.7% |
| Median | 95.0% | 97.7% |
| Interquartile 25% (IQ1) | 93.3% | 96.9% |
| Interquartile 75% (IQ3) | 96.1% | 98.8% |
| Interquartile Range (IQR) | 2.8% | 1.9% |
| Standard Deviation (Sample) | 3.0% | 1.4% |
| Standard Deviation (Population) | 3.0% | 1.4% |
Similar Demographics by 8th Grade
Demographics Similar to South Americans by 8th Grade
In terms of 8th grade, the demographic groups most similar to South Americans are Immigrants from Hong Kong (94.9%, a difference of 0.0%), Yuman (94.9%, a difference of 0.0%), Immigrants from Nigeria (94.9%, a difference of 0.010%), Immigrants from Costa Rica (94.9%, a difference of 0.030%), and West Indian (94.8%, a difference of 0.050%).
| Demographics | Rating | Rank | 8th Grade |
| Afghans | 0.6 /100 | #257 | Tragic 94.9% |
| Immigrants | Congo | 0.6 /100 | #258 | Tragic 94.9% |
| Ghanaians | 0.6 /100 | #259 | Tragic 94.9% |
| Immigrants | Jamaica | 0.6 /100 | #260 | Tragic 94.9% |
| Immigrants | Costa Rica | 0.5 /100 | #261 | Tragic 94.9% |
| Immigrants | Nigeria | 0.4 /100 | #262 | Tragic 94.9% |
| Immigrants | Hong Kong | 0.4 /100 | #263 | Tragic 94.9% |
| South Americans | 0.4 /100 | #264 | Tragic 94.9% |
| Yuman | 0.4 /100 | #265 | Tragic 94.9% |
| West Indians | 0.3 /100 | #266 | Tragic 94.8% |
| Immigrants | Ghana | 0.3 /100 | #267 | Tragic 94.8% |
| Immigrants | Uruguay | 0.3 /100 | #268 | Tragic 94.8% |
| Immigrants | Thailand | 0.2 /100 | #269 | Tragic 94.8% |
| Immigrants | Uzbekistan | 0.2 /100 | #270 | Tragic 94.8% |
| Immigrants | Afghanistan | 0.2 /100 | #271 | Tragic 94.8% |
Demographics Similar to Immigrants from India by 8th Grade
In terms of 8th grade, the demographic groups most similar to Immigrants from India are Ukrainian (96.7%, a difference of 0.0%), Native Hawaiian (96.6%, a difference of 0.0%), Canadian (96.6%, a difference of 0.010%), Iranian (96.6%, a difference of 0.010%), and White/Caucasian (96.7%, a difference of 0.020%).
| Demographics | Rating | Rank | 8th Grade |
| Macedonians | 99.8 /100 | #57 | Exceptional 96.7% |
| Immigrants | Canada | 99.8 /100 | #58 | Exceptional 96.7% |
| Immigrants | North America | 99.8 /100 | #59 | Exceptional 96.7% |
| Immigrants | Northern Europe | 99.8 /100 | #60 | Exceptional 96.7% |
| Immigrants | Austria | 99.8 /100 | #61 | Exceptional 96.7% |
| Whites/Caucasians | 99.8 /100 | #62 | Exceptional 96.7% |
| Ukrainians | 99.7 /100 | #63 | Exceptional 96.7% |
| Immigrants | India | 99.7 /100 | #64 | Exceptional 96.6% |
| Native Hawaiians | 99.7 /100 | #65 | Exceptional 96.6% |
| Canadians | 99.7 /100 | #66 | Exceptional 96.6% |
| Iranians | 99.7 /100 | #67 | Exceptional 96.6% |
| Creek | 99.7 /100 | #68 | Exceptional 96.6% |
| Americans | 99.7 /100 | #69 | Exceptional 96.6% |
| Immigrants | Lithuania | 99.6 /100 | #70 | Exceptional 96.6% |
| New Zealanders | 99.5 /100 | #71 | Exceptional 96.6% |