South American vs Immigrants from Bolivia 8th Grade
COMPARE
South American
Immigrants from Bolivia
8th Grade
8th Grade Comparison
South Americans
Immigrants from Bolivia
94.9%
8TH GRADE
0.4/ 100
METRIC RATING
264th/ 347
METRIC RANK
94.6%
8TH GRADE
0.1/ 100
METRIC RATING
281st/ 347
METRIC RANK
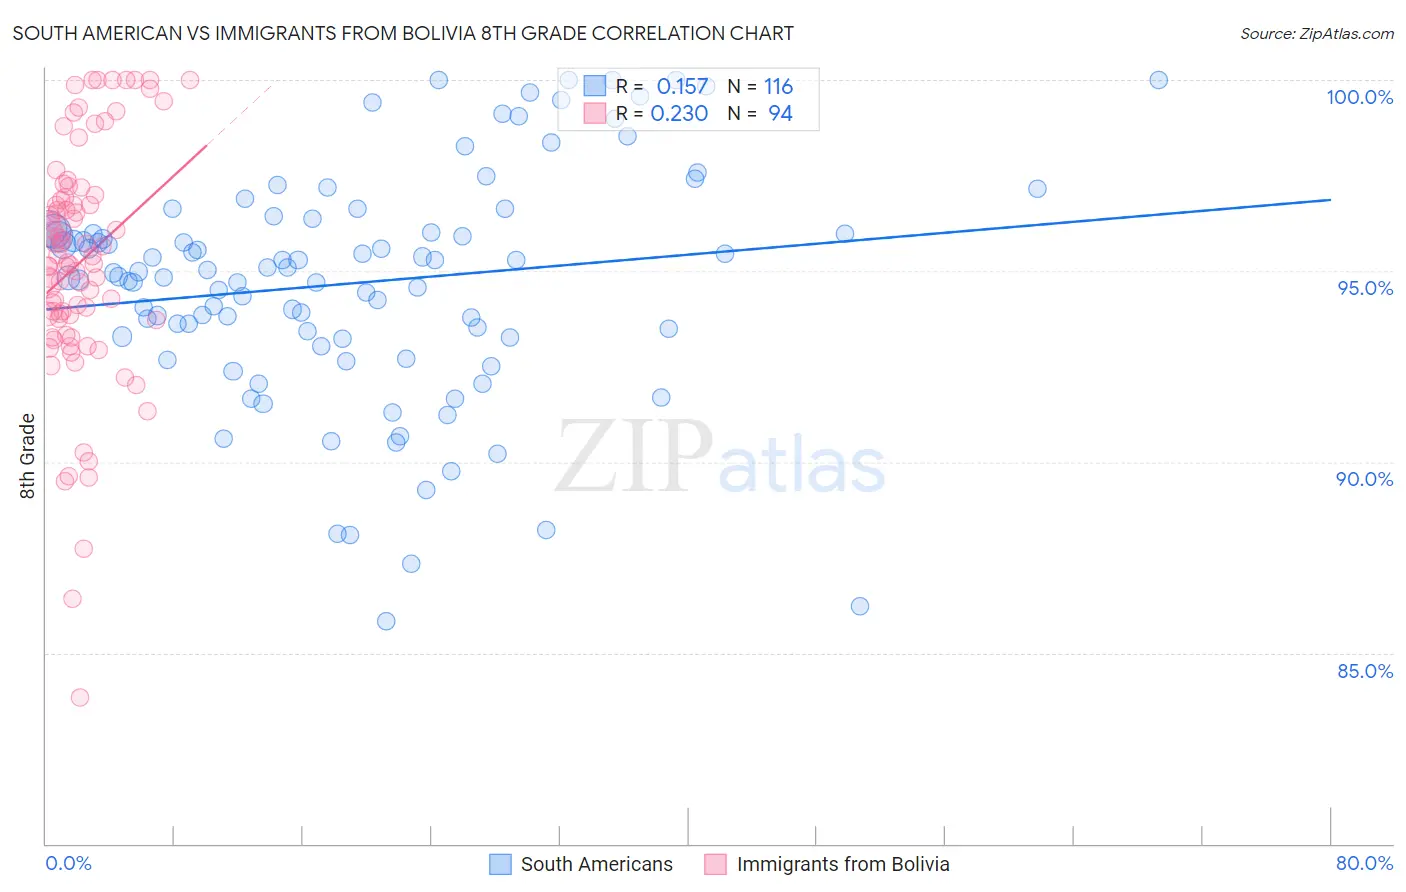
South American vs Immigrants from Bolivia 8th Grade Correlation Chart
The statistical analysis conducted on geographies consisting of 494,065,697 people shows a poor positive correlation between the proportion of South Americans and percentage of population with at least 8th grade education in the United States with a correlation coefficient (R) of 0.157 and weighted average of 94.9%. Similarly, the statistical analysis conducted on geographies consisting of 158,727,163 people shows a weak positive correlation between the proportion of Immigrants from Bolivia and percentage of population with at least 8th grade education in the United States with a correlation coefficient (R) of 0.230 and weighted average of 94.6%, a difference of 0.25%.
8th Grade Correlation Summary
| Measurement | South American | Immigrants from Bolivia |
| Minimum | 85.8% | 83.8% |
| Maximum | 100.0% | 100.0% |
| Range | 14.2% | 16.2% |
| Mean | 94.7% | 95.2% |
| Median | 95.0% | 95.3% |
| Interquartile 25% (IQ1) | 93.3% | 93.7% |
| Interquartile 75% (IQ3) | 96.1% | 96.9% |
| Interquartile Range (IQR) | 2.8% | 3.2% |
| Standard Deviation (Sample) | 3.0% | 3.1% |
| Standard Deviation (Population) | 3.0% | 3.1% |
Demographics Similar to South Americans and Immigrants from Bolivia by 8th Grade
In terms of 8th grade, the demographic groups most similar to South Americans are Immigrants from Hong Kong (94.9%, a difference of 0.0%), Yuman (94.9%, a difference of 0.0%), Immigrants from Nigeria (94.9%, a difference of 0.010%), West Indian (94.8%, a difference of 0.050%), and Immigrants from Ghana (94.8%, a difference of 0.060%). Similarly, the demographic groups most similar to Immigrants from Bolivia are Barbadian (94.6%, a difference of 0.0%), Immigrants from Trinidad and Tobago (94.6%, a difference of 0.010%), Armenian (94.7%, a difference of 0.020%), Taiwanese (94.7%, a difference of 0.040%), and Immigrants from Eritrea (94.6%, a difference of 0.040%).
| Demographics | Rating | Rank | 8th Grade |
| Immigrants | Nigeria | 0.4 /100 | #262 | Tragic 94.9% |
| Immigrants | Hong Kong | 0.4 /100 | #263 | Tragic 94.9% |
| South Americans | 0.4 /100 | #264 | Tragic 94.9% |
| Yuman | 0.4 /100 | #265 | Tragic 94.9% |
| West Indians | 0.3 /100 | #266 | Tragic 94.8% |
| Immigrants | Ghana | 0.3 /100 | #267 | Tragic 94.8% |
| Immigrants | Uruguay | 0.3 /100 | #268 | Tragic 94.8% |
| Immigrants | Thailand | 0.2 /100 | #269 | Tragic 94.8% |
| Immigrants | Uzbekistan | 0.2 /100 | #270 | Tragic 94.8% |
| Immigrants | Afghanistan | 0.2 /100 | #271 | Tragic 94.8% |
| Immigrants | South America | 0.2 /100 | #272 | Tragic 94.8% |
| Immigrants | Western Africa | 0.2 /100 | #273 | Tragic 94.8% |
| Trinidadians and Tobagonians | 0.2 /100 | #274 | Tragic 94.7% |
| Immigrants | Colombia | 0.2 /100 | #275 | Tragic 94.7% |
| Peruvians | 0.1 /100 | #276 | Tragic 94.7% |
| Taiwanese | 0.1 /100 | #277 | Tragic 94.7% |
| Armenians | 0.1 /100 | #278 | Tragic 94.7% |
| Immigrants | Trinidad and Tobago | 0.1 /100 | #279 | Tragic 94.6% |
| Barbadians | 0.1 /100 | #280 | Tragic 94.6% |
| Immigrants | Bolivia | 0.1 /100 | #281 | Tragic 94.6% |
| Immigrants | Eritrea | 0.1 /100 | #282 | Tragic 94.6% |