Slovene vs Yakama 6th Grade
COMPARE
Slovene
Yakama
6th Grade
6th Grade Comparison
Slovenes
Yakama
98.2%
6TH GRADE
100.0/ 100
METRIC RATING
9th/ 347
METRIC RANK
94.3%
6TH GRADE
0.0/ 100
METRIC RATING
339th/ 347
METRIC RANK
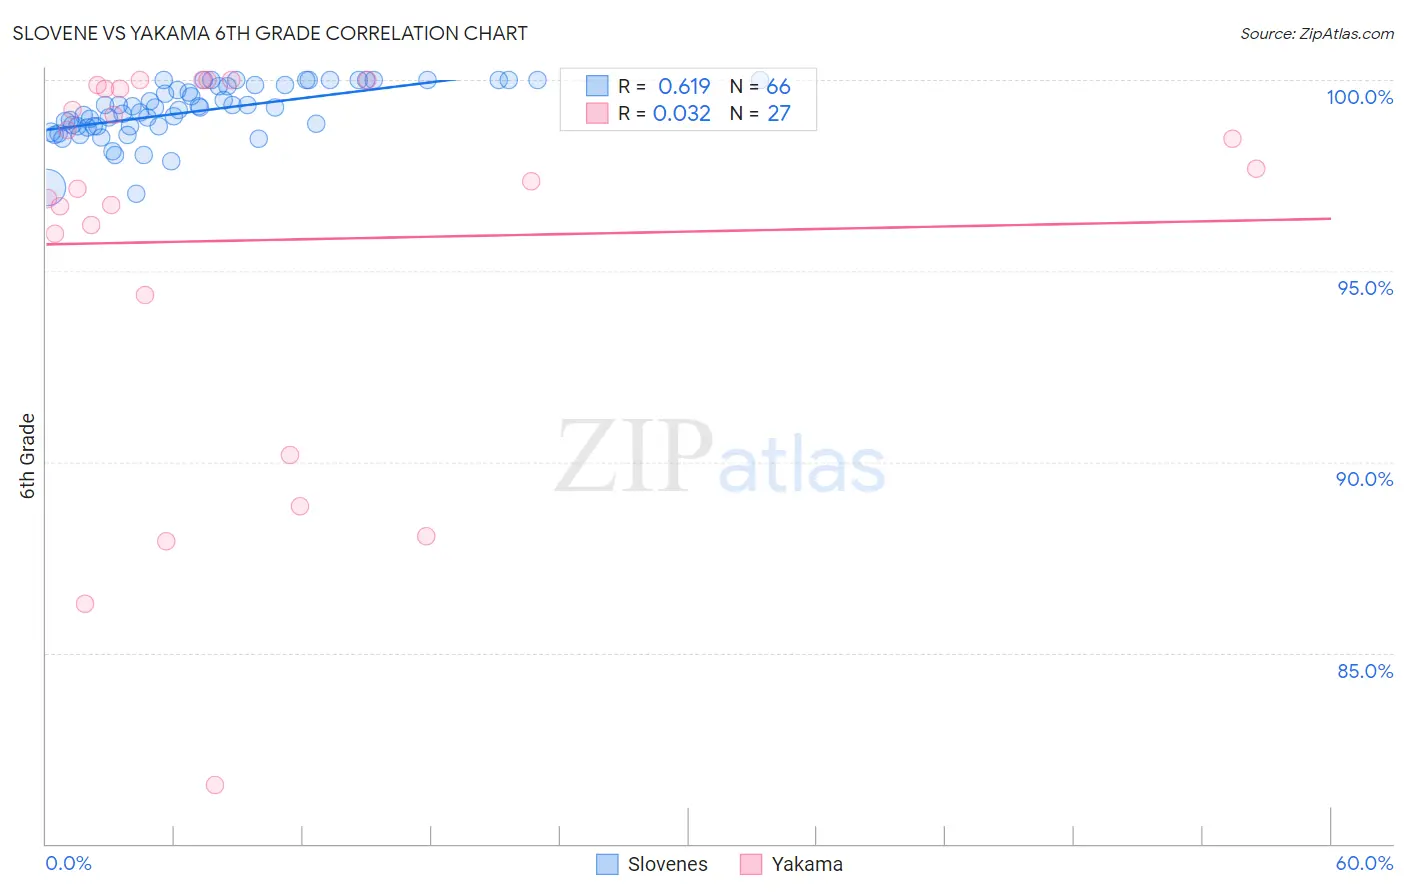
Slovene vs Yakama 6th Grade Correlation Chart
The statistical analysis conducted on geographies consisting of 261,353,374 people shows a significant positive correlation between the proportion of Slovenes and percentage of population with at least 6th grade education in the United States with a correlation coefficient (R) of 0.619 and weighted average of 98.2%. Similarly, the statistical analysis conducted on geographies consisting of 19,923,144 people shows no correlation between the proportion of Yakama and percentage of population with at least 6th grade education in the United States with a correlation coefficient (R) of 0.032 and weighted average of 94.3%, a difference of 4.1%.
6th Grade Correlation Summary
| Measurement | Slovene | Yakama |
| Minimum | 97.0% | 81.5% |
| Maximum | 100.0% | 100.0% |
| Range | 3.0% | 18.5% |
| Mean | 99.2% | 95.8% |
| Median | 99.3% | 97.3% |
| Interquartile 25% (IQ1) | 98.8% | 94.4% |
| Interquartile 75% (IQ3) | 99.9% | 99.8% |
| Interquartile Range (IQR) | 1.1% | 5.4% |
| Standard Deviation (Sample) | 0.70% | 5.1% |
| Standard Deviation (Population) | 0.70% | 5.0% |
Similar Demographics by 6th Grade
Demographics Similar to Slovenes by 6th Grade
In terms of 6th grade, the demographic groups most similar to Slovenes are Swedish (98.2%, a difference of 0.030%), English (98.1%, a difference of 0.040%), Slovak (98.2%, a difference of 0.050%), Alaskan Athabascan (98.1%, a difference of 0.050%), and German (98.2%, a difference of 0.060%).
| Demographics | Rating | Rank | 6th Grade |
| Ottawa | 100.0 /100 | #2 | Exceptional 98.5% |
| Welsh | 100.0 /100 | #3 | Exceptional 98.5% |
| Dutch | 100.0 /100 | #4 | Exceptional 98.4% |
| Tsimshian | 100.0 /100 | #5 | Exceptional 98.3% |
| Norwegians | 100.0 /100 | #6 | Exceptional 98.3% |
| Germans | 100.0 /100 | #7 | Exceptional 98.2% |
| Slovaks | 100.0 /100 | #8 | Exceptional 98.2% |
| Slovenes | 100.0 /100 | #9 | Exceptional 98.2% |
| Swedes | 100.0 /100 | #10 | Exceptional 98.2% |
| English | 100.0 /100 | #11 | Exceptional 98.1% |
| Alaskan Athabascans | 100.0 /100 | #12 | Exceptional 98.1% |
| Tlingit-Haida | 100.0 /100 | #13 | Exceptional 98.1% |
| Carpatho Rusyns | 100.0 /100 | #14 | Exceptional 98.1% |
| Inupiat | 100.0 /100 | #15 | Exceptional 98.1% |
| Scottish | 100.0 /100 | #16 | Exceptional 98.1% |
Demographics Similar to Yakama by 6th Grade
In terms of 6th grade, the demographic groups most similar to Yakama are Guatemalan (94.2%, a difference of 0.11%), Central American (94.5%, a difference of 0.15%), Immigrants from Cabo Verde (94.4%, a difference of 0.15%), Immigrants from Yemen (94.1%, a difference of 0.22%), and Immigrants from Central America (94.0%, a difference of 0.32%).
| Demographics | Rating | Rank | 6th Grade |
| Immigrants | Honduras | 0.0 /100 | #332 | Tragic 94.8% |
| Immigrants | Latin America | 0.0 /100 | #333 | Tragic 94.7% |
| Immigrants | Azores | 0.0 /100 | #334 | Tragic 94.7% |
| Mexicans | 0.0 /100 | #335 | Tragic 94.6% |
| Immigrants | Dominican Republic | 0.0 /100 | #336 | Tragic 94.6% |
| Central Americans | 0.0 /100 | #337 | Tragic 94.5% |
| Immigrants | Cabo Verde | 0.0 /100 | #338 | Tragic 94.4% |
| Yakama | 0.0 /100 | #339 | Tragic 94.3% |
| Guatemalans | 0.0 /100 | #340 | Tragic 94.2% |
| Immigrants | Yemen | 0.0 /100 | #341 | Tragic 94.1% |
| Immigrants | Central America | 0.0 /100 | #342 | Tragic 94.0% |
| Immigrants | Mexico | 0.0 /100 | #343 | Tragic 93.9% |
| Immigrants | Guatemala | 0.0 /100 | #344 | Tragic 93.9% |
| Salvadorans | 0.0 /100 | #345 | Tragic 93.9% |
| Spanish American Indians | 0.0 /100 | #346 | Tragic 93.6% |