Romanian vs Yakama 6th Grade
COMPARE
Romanian
Yakama
6th Grade
6th Grade Comparison
Romanians
Yakama
97.5%
6TH GRADE
98.7/ 100
METRIC RATING
92nd/ 347
METRIC RANK
94.3%
6TH GRADE
0.0/ 100
METRIC RATING
339th/ 347
METRIC RANK
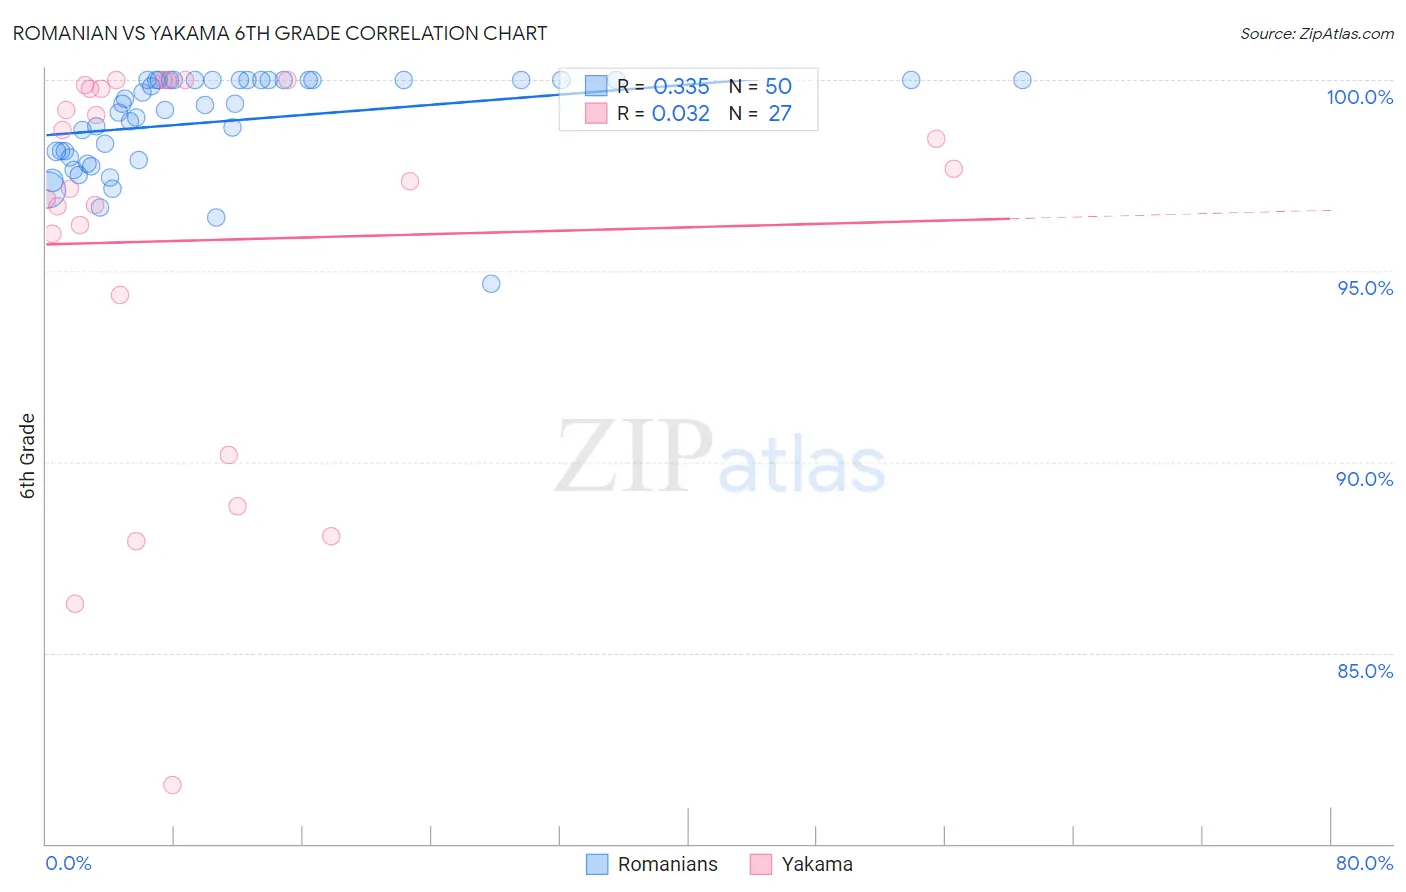
Romanian vs Yakama 6th Grade Correlation Chart
The statistical analysis conducted on geographies consisting of 377,904,438 people shows a mild positive correlation between the proportion of Romanians and percentage of population with at least 6th grade education in the United States with a correlation coefficient (R) of 0.335 and weighted average of 97.5%. Similarly, the statistical analysis conducted on geographies consisting of 19,923,144 people shows no correlation between the proportion of Yakama and percentage of population with at least 6th grade education in the United States with a correlation coefficient (R) of 0.032 and weighted average of 94.3%, a difference of 3.4%.
6th Grade Correlation Summary
| Measurement | Romanian | Yakama |
| Minimum | 94.7% | 81.5% |
| Maximum | 100.0% | 100.0% |
| Range | 5.3% | 18.5% |
| Mean | 98.9% | 95.8% |
| Median | 99.4% | 97.3% |
| Interquartile 25% (IQ1) | 98.0% | 94.4% |
| Interquartile 75% (IQ3) | 100.0% | 99.8% |
| Interquartile Range (IQR) | 2.0% | 5.4% |
| Standard Deviation (Sample) | 1.3% | 5.1% |
| Standard Deviation (Population) | 1.2% | 5.0% |
Similar Demographics by 6th Grade
Demographics Similar to Romanians by 6th Grade
In terms of 6th grade, the demographic groups most similar to Romanians are Cree (97.5%, a difference of 0.0%), Cypriot (97.5%, a difference of 0.0%), Immigrants from Ireland (97.5%, a difference of 0.0%), Immigrants from South Africa (97.5%, a difference of 0.010%), and Immigrants from Australia (97.5%, a difference of 0.010%).
| Demographics | Rating | Rank | 6th Grade |
| Delaware | 98.9 /100 | #85 | Exceptional 97.6% |
| Immigrants | Belgium | 98.9 /100 | #86 | Exceptional 97.5% |
| Puget Sound Salish | 98.9 /100 | #87 | Exceptional 97.5% |
| Immigrants | South Africa | 98.9 /100 | #88 | Exceptional 97.5% |
| Immigrants | Australia | 98.8 /100 | #89 | Exceptional 97.5% |
| Pueblo | 98.8 /100 | #90 | Exceptional 97.5% |
| Immigrants | Western Europe | 98.8 /100 | #91 | Exceptional 97.5% |
| Romanians | 98.7 /100 | #92 | Exceptional 97.5% |
| Cree | 98.7 /100 | #93 | Exceptional 97.5% |
| Cypriots | 98.7 /100 | #94 | Exceptional 97.5% |
| Immigrants | Ireland | 98.7 /100 | #95 | Exceptional 97.5% |
| Immigrants | Germany | 98.6 /100 | #96 | Exceptional 97.5% |
| Immigrants | Sweden | 98.6 /100 | #97 | Exceptional 97.5% |
| Immigrants | Denmark | 98.5 /100 | #98 | Exceptional 97.5% |
| Yugoslavians | 98.5 /100 | #99 | Exceptional 97.5% |
Demographics Similar to Yakama by 6th Grade
In terms of 6th grade, the demographic groups most similar to Yakama are Guatemalan (94.2%, a difference of 0.11%), Central American (94.5%, a difference of 0.15%), Immigrants from Cabo Verde (94.4%, a difference of 0.15%), Immigrants from Yemen (94.1%, a difference of 0.22%), and Immigrants from Central America (94.0%, a difference of 0.32%).
| Demographics | Rating | Rank | 6th Grade |
| Immigrants | Honduras | 0.0 /100 | #332 | Tragic 94.8% |
| Immigrants | Latin America | 0.0 /100 | #333 | Tragic 94.7% |
| Immigrants | Azores | 0.0 /100 | #334 | Tragic 94.7% |
| Mexicans | 0.0 /100 | #335 | Tragic 94.6% |
| Immigrants | Dominican Republic | 0.0 /100 | #336 | Tragic 94.6% |
| Central Americans | 0.0 /100 | #337 | Tragic 94.5% |
| Immigrants | Cabo Verde | 0.0 /100 | #338 | Tragic 94.4% |
| Yakama | 0.0 /100 | #339 | Tragic 94.3% |
| Guatemalans | 0.0 /100 | #340 | Tragic 94.2% |
| Immigrants | Yemen | 0.0 /100 | #341 | Tragic 94.1% |
| Immigrants | Central America | 0.0 /100 | #342 | Tragic 94.0% |
| Immigrants | Mexico | 0.0 /100 | #343 | Tragic 93.9% |
| Immigrants | Guatemala | 0.0 /100 | #344 | Tragic 93.9% |
| Salvadorans | 0.0 /100 | #345 | Tragic 93.9% |
| Spanish American Indians | 0.0 /100 | #346 | Tragic 93.6% |