Sioux vs Immigrants from Bahamas 3rd Grade
COMPARE
Sioux
Immigrants from Bahamas
3rd Grade
3rd Grade Comparison
Sioux
Immigrants from Bahamas
98.5%
3RD GRADE
100.0/ 100
METRIC RATING
23rd/ 347
METRIC RANK
97.6%
3RD GRADE
8.5/ 100
METRIC RATING
212th/ 347
METRIC RANK
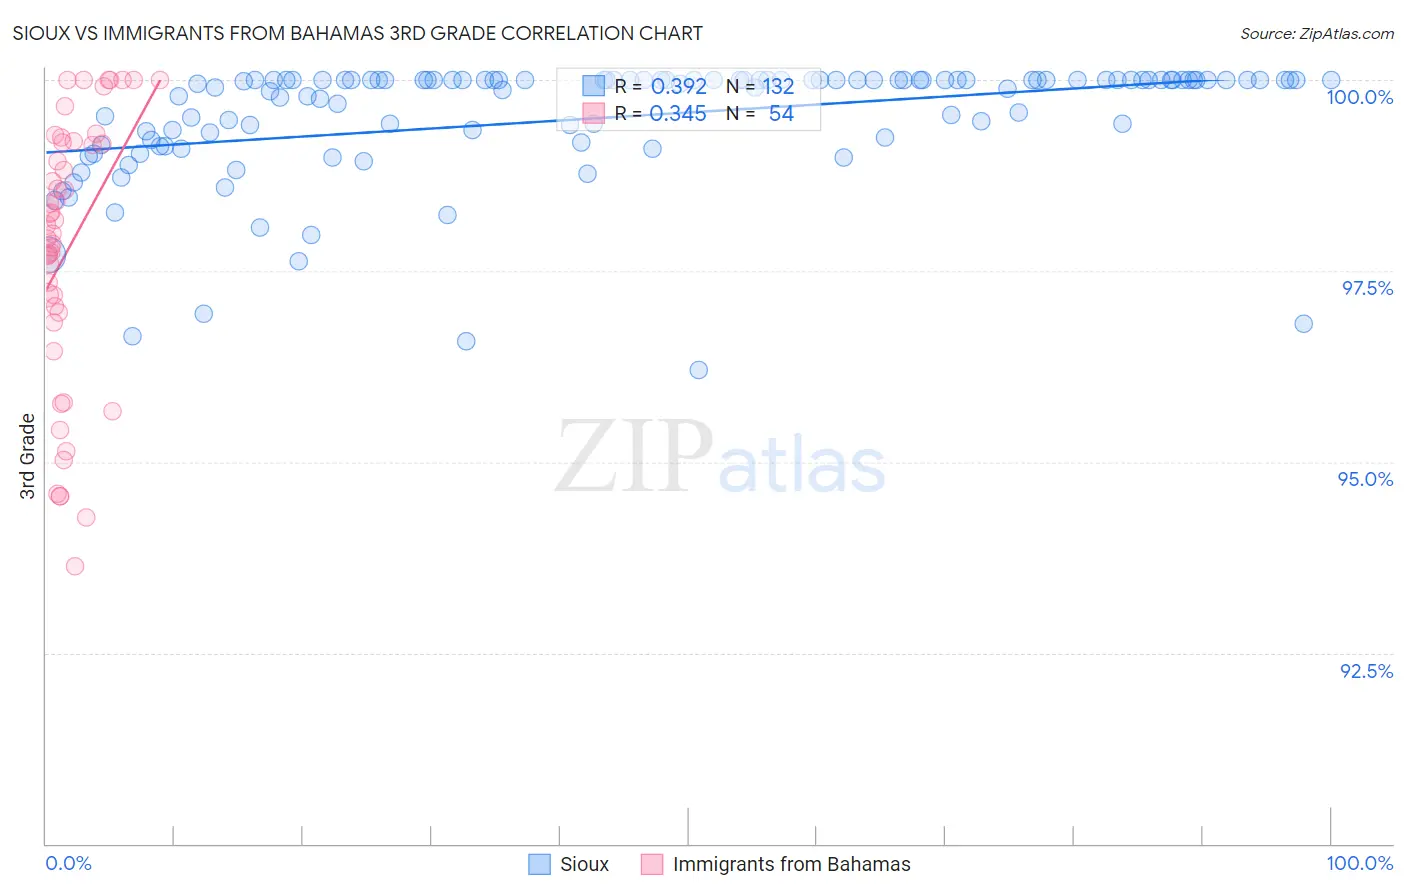
Sioux vs Immigrants from Bahamas 3rd Grade Correlation Chart
The statistical analysis conducted on geographies consisting of 234,197,392 people shows a mild positive correlation between the proportion of Sioux and percentage of population with at least 3rd grade education in the United States with a correlation coefficient (R) of 0.392 and weighted average of 98.5%. Similarly, the statistical analysis conducted on geographies consisting of 104,666,627 people shows a mild positive correlation between the proportion of Immigrants from Bahamas and percentage of population with at least 3rd grade education in the United States with a correlation coefficient (R) of 0.345 and weighted average of 97.6%, a difference of 0.94%.
3rd Grade Correlation Summary
| Measurement | Sioux | Immigrants from Bahamas |
| Minimum | 96.2% | 93.6% |
| Maximum | 100.0% | 100.0% |
| Range | 3.8% | 6.4% |
| Mean | 99.5% | 97.8% |
| Median | 100.0% | 98.0% |
| Interquartile 25% (IQ1) | 99.2% | 97.0% |
| Interquartile 75% (IQ3) | 100.0% | 99.2% |
| Interquartile Range (IQR) | 0.80% | 2.2% |
| Standard Deviation (Sample) | 0.80% | 1.7% |
| Standard Deviation (Population) | 0.80% | 1.7% |
Similar Demographics by 3rd Grade
Demographics Similar to Sioux by 3rd Grade
In terms of 3rd grade, the demographic groups most similar to Sioux are Lithuanian (98.5%, a difference of 0.0%), Finnish (98.5%, a difference of 0.0%), Polish (98.5%, a difference of 0.010%), Pennsylvania German (98.5%, a difference of 0.010%), and Danish (98.5%, a difference of 0.010%).
| Demographics | Rating | Rank | 3rd Grade |
| Scottish | 100.0 /100 | #16 | Exceptional 98.5% |
| Dutch | 100.0 /100 | #17 | Exceptional 98.5% |
| Irish | 100.0 /100 | #18 | Exceptional 98.5% |
| Poles | 100.0 /100 | #19 | Exceptional 98.5% |
| Pennsylvania Germans | 100.0 /100 | #20 | Exceptional 98.5% |
| Lithuanians | 100.0 /100 | #21 | Exceptional 98.5% |
| Finns | 100.0 /100 | #22 | Exceptional 98.5% |
| Sioux | 100.0 /100 | #23 | Exceptional 98.5% |
| Danes | 100.0 /100 | #24 | Exceptional 98.5% |
| Scotch-Irish | 100.0 /100 | #25 | Exceptional 98.5% |
| Aleuts | 100.0 /100 | #26 | Exceptional 98.5% |
| Croatians | 100.0 /100 | #27 | Exceptional 98.5% |
| French | 100.0 /100 | #28 | Exceptional 98.4% |
| French Canadians | 100.0 /100 | #29 | Exceptional 98.4% |
| Europeans | 100.0 /100 | #30 | Exceptional 98.4% |
Demographics Similar to Immigrants from Bahamas by 3rd Grade
In terms of 3rd grade, the demographic groups most similar to Immigrants from Bahamas are Moroccan (97.6%, a difference of 0.0%), Yuman (97.6%, a difference of 0.0%), Costa Rican (97.6%, a difference of 0.010%), Immigrants from Oceania (97.6%, a difference of 0.010%), and Laotian (97.6%, a difference of 0.010%).
| Demographics | Rating | Rank | 3rd Grade |
| Africans | 14.5 /100 | #205 | Poor 97.6% |
| Immigrants | Northern Africa | 13.0 /100 | #206 | Poor 97.6% |
| Tohono O'odham | 12.5 /100 | #207 | Poor 97.6% |
| Immigrants | Zaire | 11.9 /100 | #208 | Poor 97.6% |
| Costa Ricans | 9.6 /100 | #209 | Tragic 97.6% |
| Immigrants | Oceania | 9.5 /100 | #210 | Tragic 97.6% |
| Laotians | 9.4 /100 | #211 | Tragic 97.6% |
| Immigrants | Bahamas | 8.5 /100 | #212 | Tragic 97.6% |
| Moroccans | 8.5 /100 | #213 | Tragic 97.6% |
| Yuman | 8.4 /100 | #214 | Tragic 97.6% |
| Iraqis | 6.9 /100 | #215 | Tragic 97.5% |
| Samoans | 6.9 /100 | #216 | Tragic 97.5% |
| South American Indians | 5.7 /100 | #217 | Tragic 97.5% |
| Immigrants | Nepal | 5.3 /100 | #218 | Tragic 97.5% |
| Immigrants | Panama | 5.2 /100 | #219 | Tragic 97.5% |