Sierra Leonean vs Immigrants from Uganda 5th Grade
COMPARE
Sierra Leonean
Immigrants from Uganda
5th Grade
5th Grade Comparison
Sierra Leoneans
Immigrants from Uganda
97.1%
5TH GRADE
6.0/ 100
METRIC RATING
221st/ 347
METRIC RANK
97.2%
5TH GRADE
21.1/ 100
METRIC RATING
198th/ 347
METRIC RANK
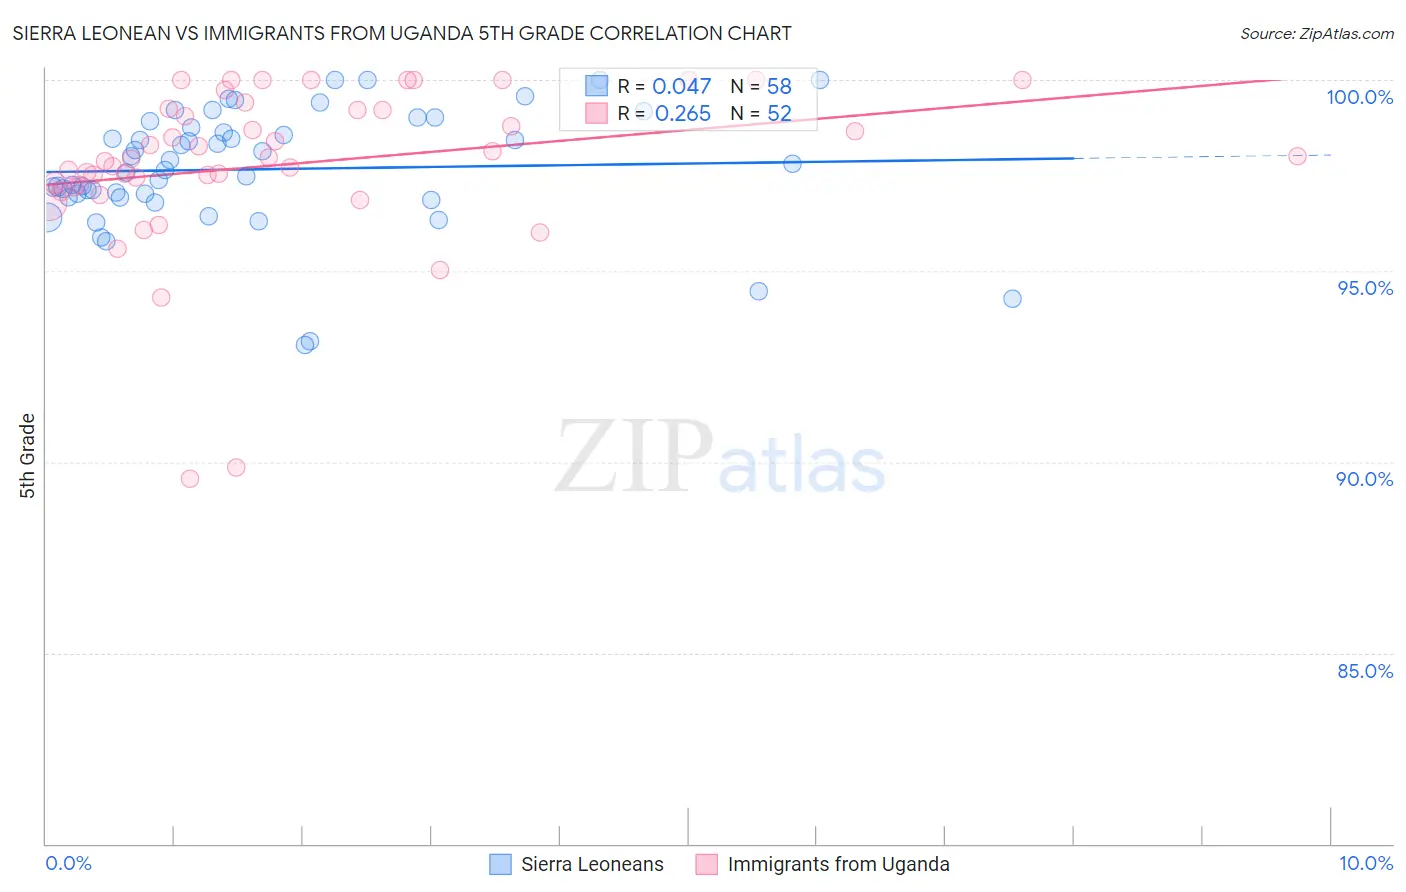
Sierra Leonean vs Immigrants from Uganda 5th Grade Correlation Chart
The statistical analysis conducted on geographies consisting of 83,337,655 people shows no correlation between the proportion of Sierra Leoneans and percentage of population with at least 5th grade education in the United States with a correlation coefficient (R) of 0.047 and weighted average of 97.1%. Similarly, the statistical analysis conducted on geographies consisting of 125,941,298 people shows a weak positive correlation between the proportion of Immigrants from Uganda and percentage of population with at least 5th grade education in the United States with a correlation coefficient (R) of 0.265 and weighted average of 97.2%, a difference of 0.15%.
5th Grade Correlation Summary
| Measurement | Sierra Leonean | Immigrants from Uganda |
| Minimum | 93.1% | 89.6% |
| Maximum | 100.0% | 100.0% |
| Range | 6.9% | 10.4% |
| Mean | 97.7% | 97.8% |
| Median | 97.7% | 98.0% |
| Interquartile 25% (IQ1) | 96.9% | 97.2% |
| Interquartile 75% (IQ3) | 98.8% | 99.2% |
| Interquartile Range (IQR) | 1.8% | 2.0% |
| Standard Deviation (Sample) | 1.6% | 2.1% |
| Standard Deviation (Population) | 1.5% | 2.1% |
Similar Demographics by 5th Grade
Demographics Similar to Sierra Leoneans by 5th Grade
In terms of 5th grade, the demographic groups most similar to Sierra Leoneans are Immigrants from Panama (97.0%, a difference of 0.0%), Immigrants from Lebanon (97.1%, a difference of 0.010%), Immigrants from Sudan (97.1%, a difference of 0.010%), Immigrants from Syria (97.1%, a difference of 0.010%), and Immigrants from Southern Europe (97.1%, a difference of 0.010%).
| Demographics | Rating | Rank | 5th Grade |
| Costa Ricans | 7.7 /100 | #214 | Tragic 97.1% |
| Immigrants | Morocco | 7.5 /100 | #215 | Tragic 97.1% |
| Sudanese | 7.0 /100 | #216 | Tragic 97.1% |
| Immigrants | Lebanon | 6.8 /100 | #217 | Tragic 97.1% |
| Immigrants | Sudan | 6.5 /100 | #218 | Tragic 97.1% |
| Immigrants | Syria | 6.4 /100 | #219 | Tragic 97.1% |
| Immigrants | Southern Europe | 6.3 /100 | #220 | Tragic 97.1% |
| Sierra Leoneans | 6.0 /100 | #221 | Tragic 97.1% |
| Immigrants | Panama | 5.7 /100 | #222 | Tragic 97.0% |
| Liberians | 5.7 /100 | #223 | Tragic 97.0% |
| South American Indians | 5.4 /100 | #224 | Tragic 97.0% |
| Bahamians | 5.3 /100 | #225 | Tragic 97.0% |
| Tongans | 5.3 /100 | #226 | Tragic 97.0% |
| Immigrants | Pakistan | 4.7 /100 | #227 | Tragic 97.0% |
| Assyrians/Chaldeans/Syriacs | 4.5 /100 | #228 | Tragic 97.0% |
Demographics Similar to Immigrants from Uganda by 5th Grade
In terms of 5th grade, the demographic groups most similar to Immigrants from Uganda are Native/Alaskan (97.2%, a difference of 0.020%), Guamanian/Chamorro (97.2%, a difference of 0.030%), Hawaiian (97.2%, a difference of 0.030%), Brazilian (97.2%, a difference of 0.030%), and Immigrants from Northern Africa (97.2%, a difference of 0.030%).
| Demographics | Rating | Rank | 5th Grade |
| Immigrants | Brazil | 31.5 /100 | #191 | Fair 97.3% |
| Panamanians | 31.3 /100 | #192 | Fair 97.3% |
| Navajo | 29.0 /100 | #193 | Fair 97.2% |
| Immigrants | Albania | 28.5 /100 | #194 | Fair 97.2% |
| Guamanians/Chamorros | 26.8 /100 | #195 | Fair 97.2% |
| Hawaiians | 25.6 /100 | #196 | Fair 97.2% |
| Brazilians | 25.4 /100 | #197 | Fair 97.2% |
| Immigrants | Uganda | 21.1 /100 | #198 | Fair 97.2% |
| Natives/Alaskans | 18.0 /100 | #199 | Poor 97.2% |
| Immigrants | Northern Africa | 16.8 /100 | #200 | Poor 97.2% |
| Immigrants | Chile | 16.6 /100 | #201 | Poor 97.2% |
| Africans | 15.3 /100 | #202 | Poor 97.2% |
| Immigrants | Bahamas | 14.9 /100 | #203 | Poor 97.2% |
| Immigrants | Zaire | 13.7 /100 | #204 | Poor 97.1% |
| Moroccans | 12.0 /100 | #205 | Poor 97.1% |