Sierra Leonean vs Immigrants from Norway 5th Grade
COMPARE
Sierra Leonean
Immigrants from Norway
5th Grade
5th Grade Comparison
Sierra Leoneans
Immigrants from Norway
97.1%
5TH GRADE
6.0/ 100
METRIC RATING
221st/ 347
METRIC RANK
97.6%
5TH GRADE
94.6/ 100
METRIC RATING
123rd/ 347
METRIC RANK
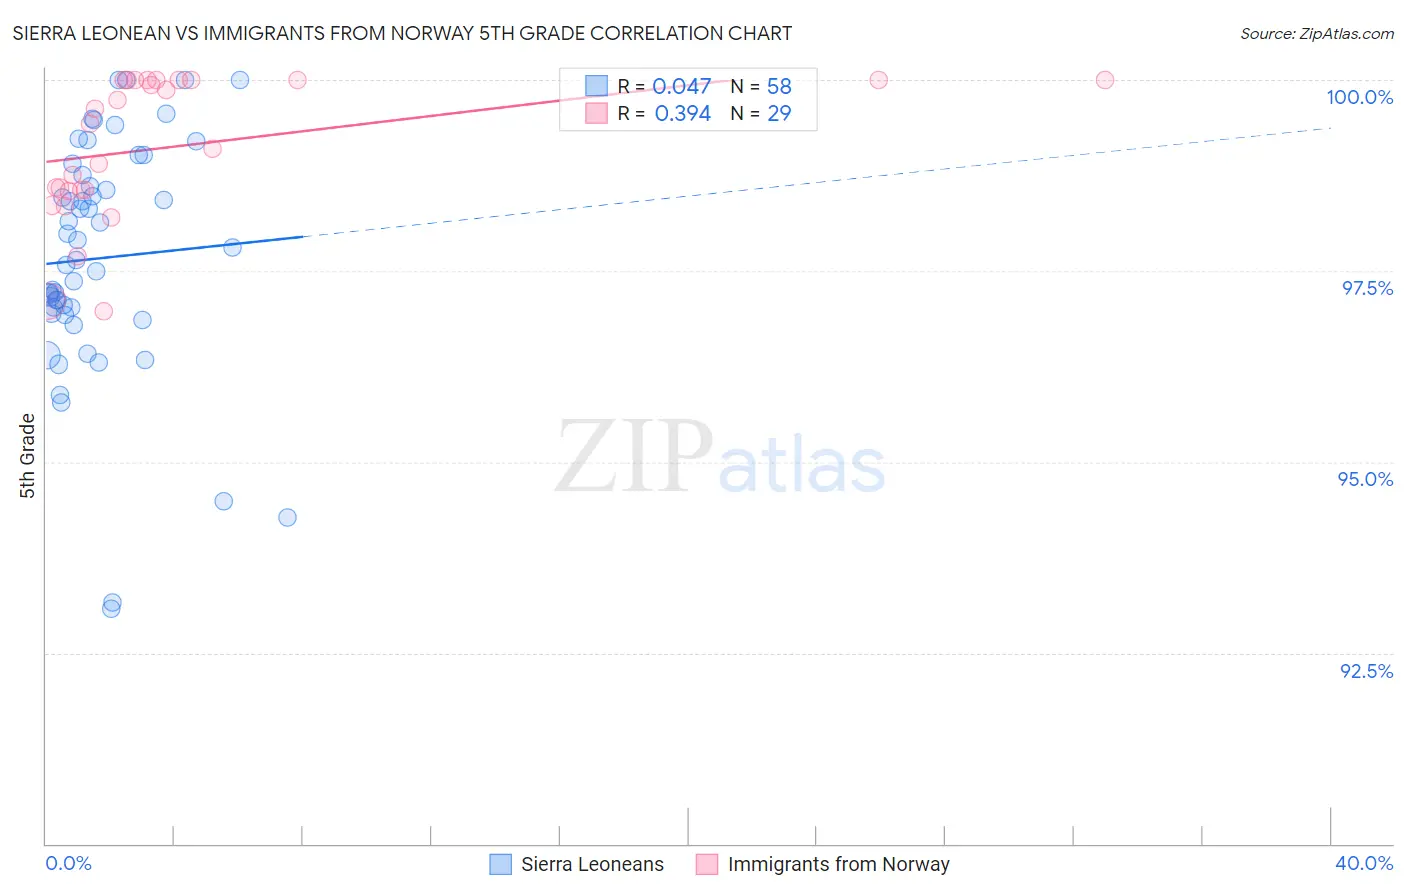
Sierra Leonean vs Immigrants from Norway 5th Grade Correlation Chart
The statistical analysis conducted on geographies consisting of 83,337,655 people shows no correlation between the proportion of Sierra Leoneans and percentage of population with at least 5th grade education in the United States with a correlation coefficient (R) of 0.047 and weighted average of 97.1%. Similarly, the statistical analysis conducted on geographies consisting of 116,716,420 people shows a mild positive correlation between the proportion of Immigrants from Norway and percentage of population with at least 5th grade education in the United States with a correlation coefficient (R) of 0.394 and weighted average of 97.6%, a difference of 0.58%.
5th Grade Correlation Summary
| Measurement | Sierra Leonean | Immigrants from Norway |
| Minimum | 93.1% | 97.0% |
| Maximum | 100.0% | 100.0% |
| Range | 6.9% | 3.0% |
| Mean | 97.7% | 99.1% |
| Median | 97.7% | 99.4% |
| Interquartile 25% (IQ1) | 96.9% | 98.5% |
| Interquartile 75% (IQ3) | 98.8% | 100.0% |
| Interquartile Range (IQR) | 1.8% | 1.5% |
| Standard Deviation (Sample) | 1.6% | 0.93% |
| Standard Deviation (Population) | 1.5% | 0.91% |
Similar Demographics by 5th Grade
Demographics Similar to Sierra Leoneans by 5th Grade
In terms of 5th grade, the demographic groups most similar to Sierra Leoneans are Immigrants from Panama (97.0%, a difference of 0.0%), Immigrants from Lebanon (97.1%, a difference of 0.010%), Immigrants from Sudan (97.1%, a difference of 0.010%), Immigrants from Syria (97.1%, a difference of 0.010%), and Immigrants from Southern Europe (97.1%, a difference of 0.010%).
| Demographics | Rating | Rank | 5th Grade |
| Costa Ricans | 7.7 /100 | #214 | Tragic 97.1% |
| Immigrants | Morocco | 7.5 /100 | #215 | Tragic 97.1% |
| Sudanese | 7.0 /100 | #216 | Tragic 97.1% |
| Immigrants | Lebanon | 6.8 /100 | #217 | Tragic 97.1% |
| Immigrants | Sudan | 6.5 /100 | #218 | Tragic 97.1% |
| Immigrants | Syria | 6.4 /100 | #219 | Tragic 97.1% |
| Immigrants | Southern Europe | 6.3 /100 | #220 | Tragic 97.1% |
| Sierra Leoneans | 6.0 /100 | #221 | Tragic 97.1% |
| Immigrants | Panama | 5.7 /100 | #222 | Tragic 97.0% |
| Liberians | 5.7 /100 | #223 | Tragic 97.0% |
| South American Indians | 5.4 /100 | #224 | Tragic 97.0% |
| Bahamians | 5.3 /100 | #225 | Tragic 97.0% |
| Tongans | 5.3 /100 | #226 | Tragic 97.0% |
| Immigrants | Pakistan | 4.7 /100 | #227 | Tragic 97.0% |
| Assyrians/Chaldeans/Syriacs | 4.5 /100 | #228 | Tragic 97.0% |
Demographics Similar to Immigrants from Norway by 5th Grade
In terms of 5th grade, the demographic groups most similar to Immigrants from Norway are Immigrants from France (97.6%, a difference of 0.0%), Immigrants from Japan (97.6%, a difference of 0.0%), Basque (97.6%, a difference of 0.010%), Syrian (97.6%, a difference of 0.010%), and Immigrants from Zimbabwe (97.6%, a difference of 0.010%).
| Demographics | Rating | Rank | 5th Grade |
| Immigrants | Croatia | 95.5 /100 | #116 | Exceptional 97.6% |
| Immigrants | Saudi Arabia | 95.4 /100 | #117 | Exceptional 97.6% |
| Basques | 95.2 /100 | #118 | Exceptional 97.6% |
| Syrians | 95.1 /100 | #119 | Exceptional 97.6% |
| Immigrants | Zimbabwe | 94.9 /100 | #120 | Exceptional 97.6% |
| Immigrants | France | 94.8 /100 | #121 | Exceptional 97.6% |
| Immigrants | Japan | 94.7 /100 | #122 | Exceptional 97.6% |
| Immigrants | Norway | 94.6 /100 | #123 | Exceptional 97.6% |
| Spanish | 93.7 /100 | #124 | Exceptional 97.6% |
| Immigrants | Bulgaria | 93.1 /100 | #125 | Exceptional 97.6% |
| Hmong | 92.3 /100 | #126 | Exceptional 97.6% |
| Immigrants | Serbia | 92.3 /100 | #127 | Exceptional 97.6% |
| Colville | 92.0 /100 | #128 | Exceptional 97.6% |
| Immigrants | Europe | 91.9 /100 | #129 | Exceptional 97.6% |
| Immigrants | Romania | 91.6 /100 | #130 | Exceptional 97.6% |