Russian vs Immigrants from Bangladesh Bachelor's Degree
COMPARE
Russian
Immigrants from Bangladesh
Bachelor's Degree
Bachelor's Degree Comparison
Russians
Immigrants from Bangladesh
45.3%
BACHELOR'S DEGREE
100.0/ 100
METRIC RATING
37th/ 347
METRIC RANK
37.8%
BACHELOR'S DEGREE
50.0/ 100
METRIC RATING
174th/ 347
METRIC RANK
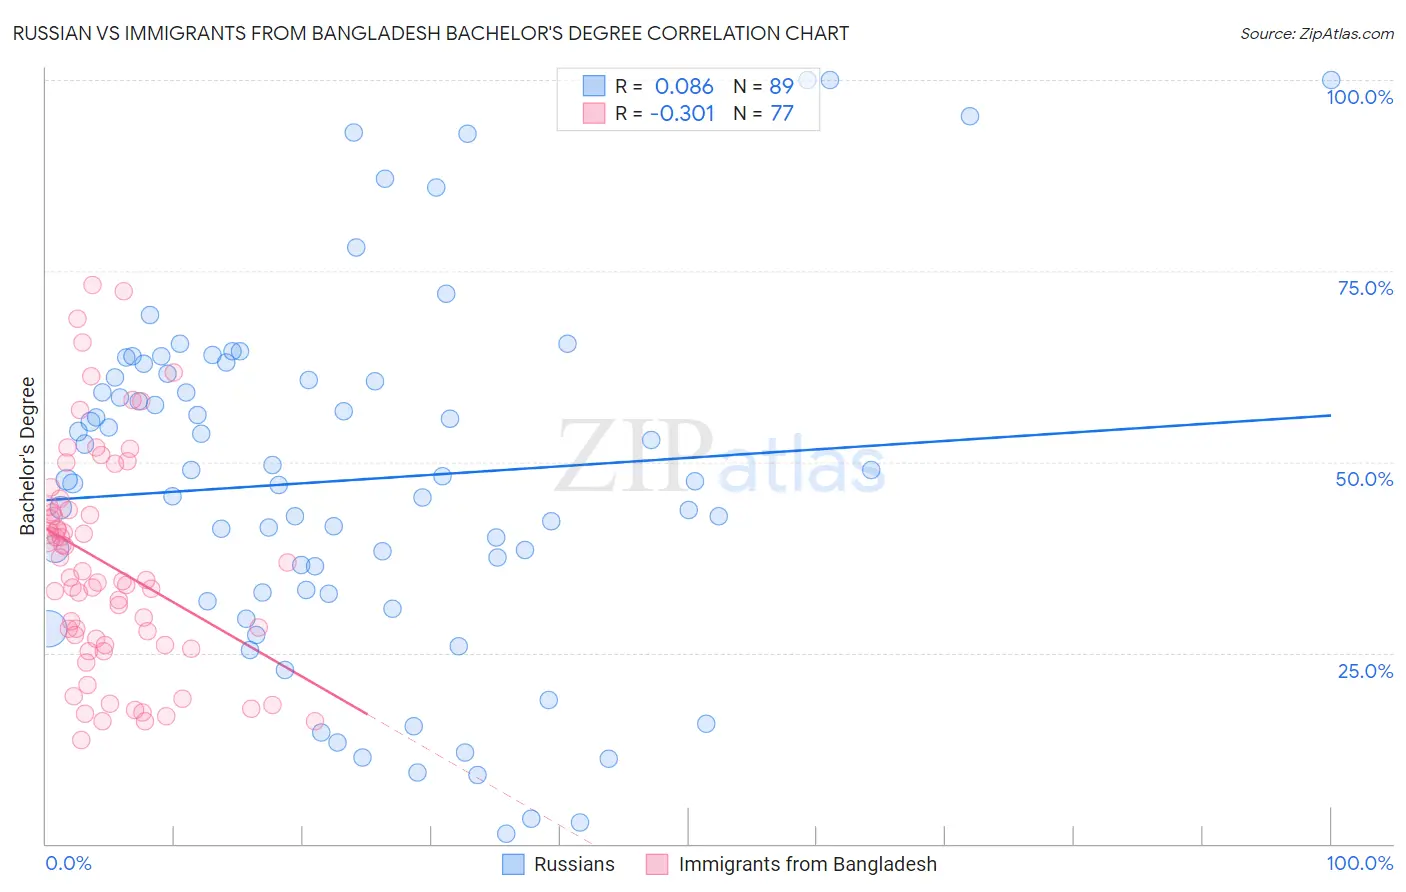
Russian vs Immigrants from Bangladesh Bachelor's Degree Correlation Chart
The statistical analysis conducted on geographies consisting of 512,185,650 people shows a slight positive correlation between the proportion of Russians and percentage of population with at least bachelor's degree education in the United States with a correlation coefficient (R) of 0.086 and weighted average of 45.3%. Similarly, the statistical analysis conducted on geographies consisting of 203,673,511 people shows a mild negative correlation between the proportion of Immigrants from Bangladesh and percentage of population with at least bachelor's degree education in the United States with a correlation coefficient (R) of -0.301 and weighted average of 37.8%, a difference of 19.9%.
Bachelor's Degree Correlation Summary
| Measurement | Russian | Immigrants from Bangladesh |
| Minimum | 1.3% | 13.5% |
| Maximum | 100.0% | 73.2% |
| Range | 98.7% | 59.7% |
| Mean | 47.6% | 36.6% |
| Median | 47.6% | 34.5% |
| Interquartile 25% (IQ1) | 32.8% | 26.1% |
| Interquartile 75% (IQ3) | 61.3% | 44.0% |
| Interquartile Range (IQR) | 28.5% | 17.9% |
| Standard Deviation (Sample) | 23.1% | 14.4% |
| Standard Deviation (Population) | 23.0% | 14.3% |
Similar Demographics by Bachelor's Degree
Demographics Similar to Russians by Bachelor's Degree
In terms of bachelor's degree, the demographic groups most similar to Russians are Bulgarian (45.3%, a difference of 0.090%), Mongolian (45.4%, a difference of 0.15%), Immigrants from Russia (45.4%, a difference of 0.17%), Immigrants from Denmark (45.4%, a difference of 0.19%), and Immigrants from Latvia (45.1%, a difference of 0.42%).
| Demographics | Rating | Rank | Bachelor's Degree |
| Immigrants | Sri Lanka | 100.0 /100 | #30 | Exceptional 46.1% |
| Latvians | 100.0 /100 | #31 | Exceptional 46.1% |
| Immigrants | Turkey | 100.0 /100 | #32 | Exceptional 46.0% |
| Immigrants | Northern Europe | 100.0 /100 | #33 | Exceptional 45.6% |
| Immigrants | Denmark | 100.0 /100 | #34 | Exceptional 45.4% |
| Immigrants | Russia | 100.0 /100 | #35 | Exceptional 45.4% |
| Mongolians | 100.0 /100 | #36 | Exceptional 45.4% |
| Russians | 100.0 /100 | #37 | Exceptional 45.3% |
| Bulgarians | 100.0 /100 | #38 | Exceptional 45.3% |
| Immigrants | Latvia | 100.0 /100 | #39 | Exceptional 45.1% |
| Immigrants | Belarus | 100.0 /100 | #40 | Exceptional 45.0% |
| Immigrants | Malaysia | 100.0 /100 | #41 | Exceptional 45.0% |
| Immigrants | Saudi Arabia | 100.0 /100 | #42 | Exceptional 44.8% |
| Immigrants | South Africa | 99.9 /100 | #43 | Exceptional 44.8% |
| Immigrants | Lithuania | 99.9 /100 | #44 | Exceptional 44.6% |
Demographics Similar to Immigrants from Bangladesh by Bachelor's Degree
In terms of bachelor's degree, the demographic groups most similar to Immigrants from Bangladesh are Immigrants from Uruguay (37.8%, a difference of 0.16%), Costa Rican (37.7%, a difference of 0.24%), Immigrants from Iraq (37.9%, a difference of 0.25%), Basque (37.7%, a difference of 0.25%), and Immigrants from Somalia (37.9%, a difference of 0.27%).
| Demographics | Rating | Rank | Bachelor's Degree |
| Scottish | 56.6 /100 | #167 | Average 38.1% |
| Danes | 56.2 /100 | #168 | Average 38.1% |
| Ghanaians | 55.3 /100 | #169 | Average 38.0% |
| Czechs | 54.4 /100 | #170 | Average 38.0% |
| Bermudans | 54.2 /100 | #171 | Average 38.0% |
| Immigrants | Somalia | 52.8 /100 | #172 | Average 37.9% |
| Immigrants | Iraq | 52.5 /100 | #173 | Average 37.9% |
| Immigrants | Bangladesh | 50.0 /100 | #174 | Average 37.8% |
| Immigrants | Uruguay | 48.3 /100 | #175 | Average 37.8% |
| Costa Ricans | 47.6 /100 | #176 | Average 37.7% |
| Basques | 47.4 /100 | #177 | Average 37.7% |
| Immigrants | Cameroon | 46.8 /100 | #178 | Average 37.7% |
| Immigrants | Colombia | 45.4 /100 | #179 | Average 37.7% |
| Irish | 44.3 /100 | #180 | Average 37.6% |
| Immigrants | Senegal | 43.8 /100 | #181 | Average 37.6% |