Black/African American vs Immigrants from Bangladesh Bachelor's Degree
COMPARE
Black/African American
Immigrants from Bangladesh
Bachelor's Degree
Bachelor's Degree Comparison
Blacks/African Americans
Immigrants from Bangladesh
30.9%
BACHELOR'S DEGREE
0.1/ 100
METRIC RATING
291st/ 347
METRIC RANK
37.8%
BACHELOR'S DEGREE
50.0/ 100
METRIC RATING
174th/ 347
METRIC RANK
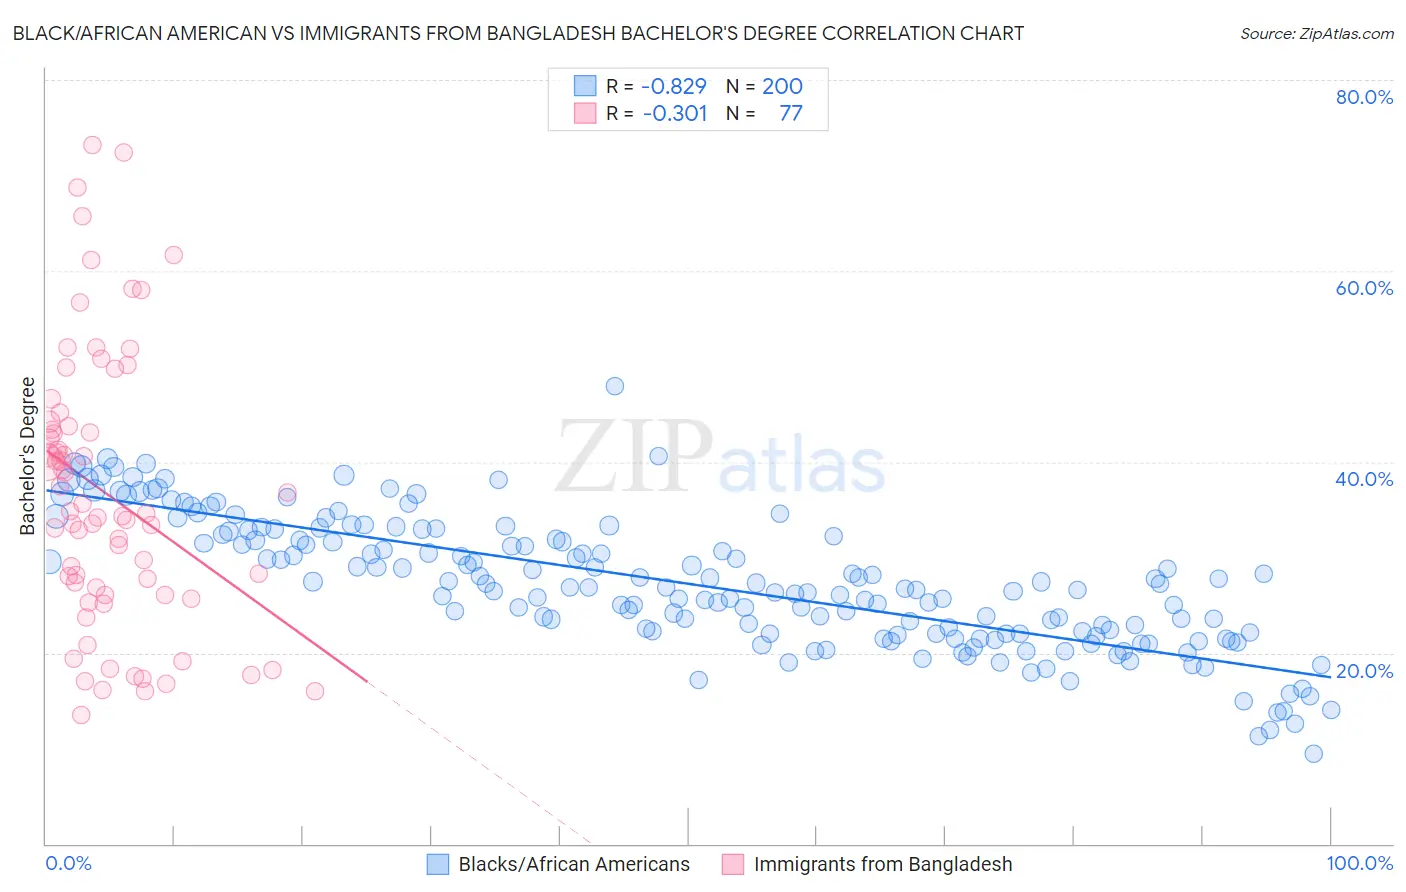
Black/African American vs Immigrants from Bangladesh Bachelor's Degree Correlation Chart
The statistical analysis conducted on geographies consisting of 565,857,967 people shows a very strong negative correlation between the proportion of Blacks/African Americans and percentage of population with at least bachelor's degree education in the United States with a correlation coefficient (R) of -0.829 and weighted average of 30.9%. Similarly, the statistical analysis conducted on geographies consisting of 203,673,511 people shows a mild negative correlation between the proportion of Immigrants from Bangladesh and percentage of population with at least bachelor's degree education in the United States with a correlation coefficient (R) of -0.301 and weighted average of 37.8%, a difference of 22.3%.
Bachelor's Degree Correlation Summary
| Measurement | Black/African American | Immigrants from Bangladesh |
| Minimum | 9.5% | 13.5% |
| Maximum | 47.9% | 73.2% |
| Range | 38.4% | 59.7% |
| Mean | 27.2% | 36.6% |
| Median | 26.9% | 34.5% |
| Interquartile 25% (IQ1) | 22.0% | 26.1% |
| Interquartile 75% (IQ3) | 32.3% | 44.0% |
| Interquartile Range (IQR) | 10.3% | 17.9% |
| Standard Deviation (Sample) | 6.8% | 14.4% |
| Standard Deviation (Population) | 6.8% | 14.3% |
Similar Demographics by Bachelor's Degree
Demographics Similar to Blacks/African Americans by Bachelor's Degree
In terms of bachelor's degree, the demographic groups most similar to Blacks/African Americans are Immigrants from Honduras (30.9%, a difference of 0.040%), Puerto Rican (31.0%, a difference of 0.080%), Ute (30.9%, a difference of 0.080%), Cape Verdean (30.9%, a difference of 0.18%), and Guatemalan (31.0%, a difference of 0.22%).
| Demographics | Rating | Rank | Bachelor's Degree |
| Haitians | 0.1 /100 | #284 | Tragic 31.3% |
| Aleuts | 0.1 /100 | #285 | Tragic 31.3% |
| Immigrants | El Salvador | 0.1 /100 | #286 | Tragic 31.3% |
| Ottawa | 0.1 /100 | #287 | Tragic 31.1% |
| Guatemalans | 0.1 /100 | #288 | Tragic 31.0% |
| Puerto Ricans | 0.1 /100 | #289 | Tragic 31.0% |
| Immigrants | Honduras | 0.1 /100 | #290 | Tragic 30.9% |
| Blacks/African Americans | 0.1 /100 | #291 | Tragic 30.9% |
| Ute | 0.1 /100 | #292 | Tragic 30.9% |
| Cape Verdeans | 0.1 /100 | #293 | Tragic 30.9% |
| Immigrants | Guatemala | 0.0 /100 | #294 | Tragic 30.8% |
| Immigrants | Dominican Republic | 0.0 /100 | #295 | Tragic 30.7% |
| Puget Sound Salish | 0.0 /100 | #296 | Tragic 30.7% |
| Immigrants | Haiti | 0.0 /100 | #297 | Tragic 30.6% |
| Chippewa | 0.0 /100 | #298 | Tragic 30.6% |
Demographics Similar to Immigrants from Bangladesh by Bachelor's Degree
In terms of bachelor's degree, the demographic groups most similar to Immigrants from Bangladesh are Immigrants from Uruguay (37.8%, a difference of 0.16%), Costa Rican (37.7%, a difference of 0.24%), Immigrants from Iraq (37.9%, a difference of 0.25%), Basque (37.7%, a difference of 0.25%), and Immigrants from Somalia (37.9%, a difference of 0.27%).
| Demographics | Rating | Rank | Bachelor's Degree |
| Scottish | 56.6 /100 | #167 | Average 38.1% |
| Danes | 56.2 /100 | #168 | Average 38.1% |
| Ghanaians | 55.3 /100 | #169 | Average 38.0% |
| Czechs | 54.4 /100 | #170 | Average 38.0% |
| Bermudans | 54.2 /100 | #171 | Average 38.0% |
| Immigrants | Somalia | 52.8 /100 | #172 | Average 37.9% |
| Immigrants | Iraq | 52.5 /100 | #173 | Average 37.9% |
| Immigrants | Bangladesh | 50.0 /100 | #174 | Average 37.8% |
| Immigrants | Uruguay | 48.3 /100 | #175 | Average 37.8% |
| Costa Ricans | 47.6 /100 | #176 | Average 37.7% |
| Basques | 47.4 /100 | #177 | Average 37.7% |
| Immigrants | Cameroon | 46.8 /100 | #178 | Average 37.7% |
| Immigrants | Colombia | 45.4 /100 | #179 | Average 37.7% |
| Irish | 44.3 /100 | #180 | Average 37.6% |
| Immigrants | Senegal | 43.8 /100 | #181 | Average 37.6% |