Panamanian vs Immigrants from Oceania 4th Grade
COMPARE
Panamanian
Immigrants from Oceania
4th Grade
4th Grade Comparison
Panamanians
Immigrants from Oceania
97.4%
4TH GRADE
31.9/ 100
METRIC RATING
189th/ 347
METRIC RANK
97.3%
4TH GRADE
9.1/ 100
METRIC RATING
210th/ 347
METRIC RANK
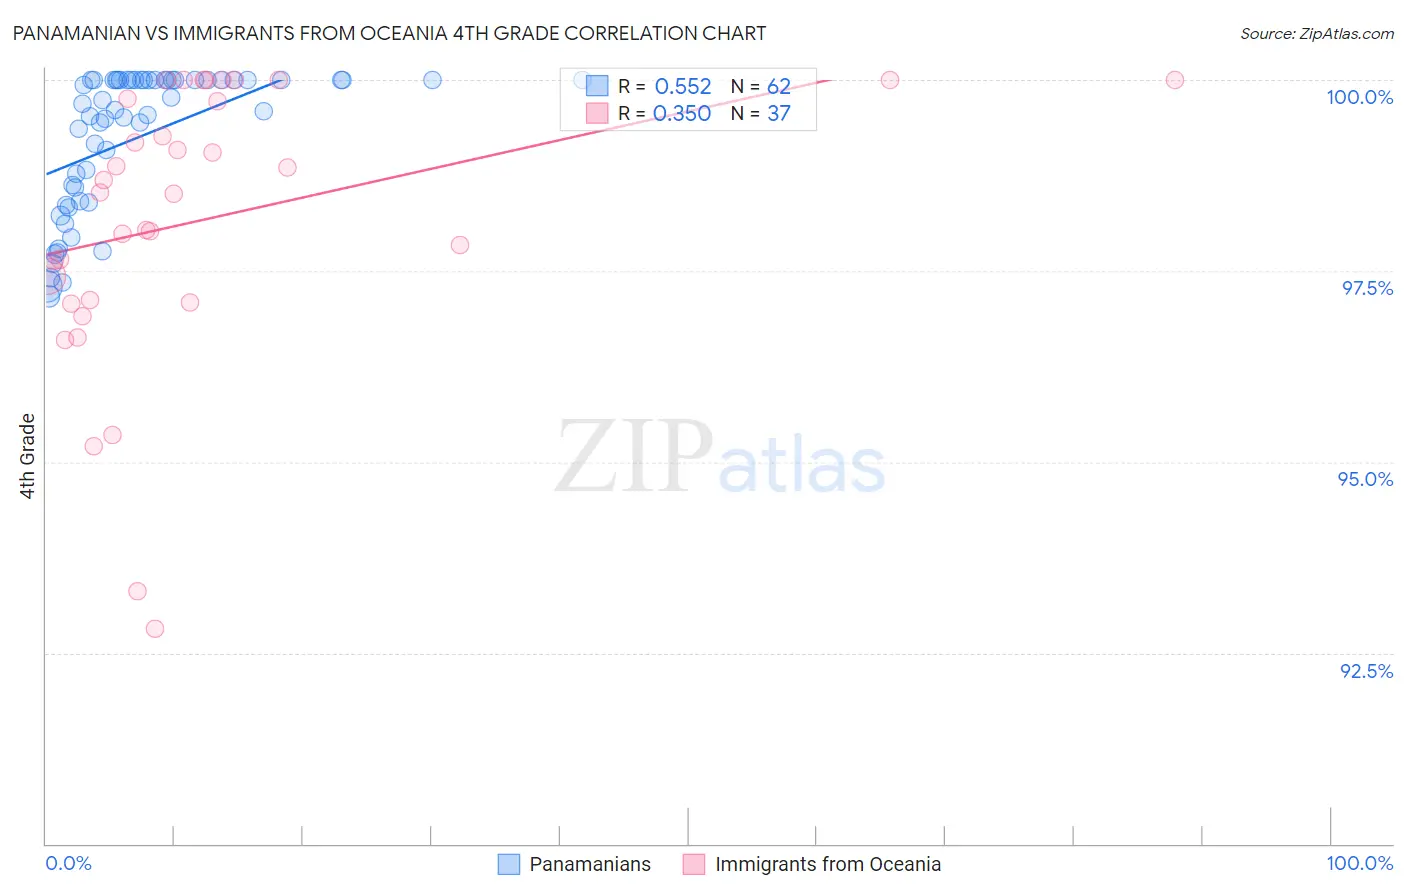
Panamanian vs Immigrants from Oceania 4th Grade Correlation Chart
The statistical analysis conducted on geographies consisting of 281,248,945 people shows a substantial positive correlation between the proportion of Panamanians and percentage of population with at least 4th grade education in the United States with a correlation coefficient (R) of 0.552 and weighted average of 97.4%. Similarly, the statistical analysis conducted on geographies consisting of 305,521,521 people shows a mild positive correlation between the proportion of Immigrants from Oceania and percentage of population with at least 4th grade education in the United States with a correlation coefficient (R) of 0.350 and weighted average of 97.3%, a difference of 0.15%.
4th Grade Correlation Summary
| Measurement | Panamanian | Immigrants from Oceania |
| Minimum | 97.2% | 92.8% |
| Maximum | 100.0% | 100.0% |
| Range | 2.8% | 7.2% |
| Mean | 99.2% | 98.2% |
| Median | 99.6% | 98.5% |
| Interquartile 25% (IQ1) | 98.4% | 97.1% |
| Interquartile 75% (IQ3) | 100.0% | 99.9% |
| Interquartile Range (IQR) | 1.6% | 2.8% |
| Standard Deviation (Sample) | 0.93% | 1.8% |
| Standard Deviation (Population) | 0.92% | 1.8% |
Similar Demographics by 4th Grade
Demographics Similar to Panamanians by 4th Grade
In terms of 4th grade, the demographic groups most similar to Panamanians are Black/African American (97.4%, a difference of 0.0%), Mongolian (97.5%, a difference of 0.010%), Immigrants from Argentina (97.5%, a difference of 0.010%), Navajo (97.4%, a difference of 0.010%), and Immigrants from Ukraine (97.4%, a difference of 0.010%).
| Demographics | Rating | Rank | 4th Grade |
| Spanish Americans | 39.3 /100 | #182 | Fair 97.5% |
| Argentineans | 39.0 /100 | #183 | Fair 97.5% |
| Pakistanis | 36.2 /100 | #184 | Fair 97.5% |
| Immigrants | Kenya | 35.8 /100 | #185 | Fair 97.5% |
| Dutch West Indians | 35.8 /100 | #186 | Fair 97.5% |
| Mongolians | 34.7 /100 | #187 | Fair 97.5% |
| Immigrants | Argentina | 34.6 /100 | #188 | Fair 97.5% |
| Panamanians | 31.9 /100 | #189 | Fair 97.4% |
| Blacks/African Americans | 31.1 /100 | #190 | Fair 97.4% |
| Navajo | 30.7 /100 | #191 | Fair 97.4% |
| Immigrants | Ukraine | 30.1 /100 | #192 | Fair 97.4% |
| Immigrants | Egypt | 30.1 /100 | #193 | Fair 97.4% |
| Portuguese | 29.2 /100 | #194 | Fair 97.4% |
| Paraguayans | 28.9 /100 | #195 | Fair 97.4% |
| Immigrants | Albania | 27.7 /100 | #196 | Fair 97.4% |
Demographics Similar to Immigrants from Oceania by 4th Grade
In terms of 4th grade, the demographic groups most similar to Immigrants from Oceania are Laotian (97.3%, a difference of 0.0%), Sudanese (97.3%, a difference of 0.0%), Tohono O'odham (97.3%, a difference of 0.010%), Costa Rican (97.3%, a difference of 0.010%), and Moroccan (97.3%, a difference of 0.020%).
| Demographics | Rating | Rank | 4th Grade |
| Immigrants | Northern Africa | 15.1 /100 | #203 | Poor 97.4% |
| Africans | 14.6 /100 | #204 | Poor 97.4% |
| Paiute | 13.2 /100 | #205 | Poor 97.3% |
| Immigrants | Zaire | 12.8 /100 | #206 | Poor 97.3% |
| Moroccans | 11.3 /100 | #207 | Poor 97.3% |
| Immigrants | Bahamas | 10.8 /100 | #208 | Poor 97.3% |
| Laotians | 9.3 /100 | #209 | Tragic 97.3% |
| Immigrants | Oceania | 9.1 /100 | #210 | Tragic 97.3% |
| Sudanese | 9.0 /100 | #211 | Tragic 97.3% |
| Tohono O'odham | 8.4 /100 | #212 | Tragic 97.3% |
| Costa Ricans | 8.3 /100 | #213 | Tragic 97.3% |
| Immigrants | Nepal | 7.7 /100 | #214 | Tragic 97.3% |
| Immigrants | Morocco | 7.1 /100 | #215 | Tragic 97.3% |
| Samoans | 6.8 /100 | #216 | Tragic 97.3% |
| Sierra Leoneans | 6.5 /100 | #217 | Tragic 97.3% |