Ottawa vs Canadian 3rd Grade
COMPARE
Ottawa
Canadian
3rd Grade
3rd Grade Comparison
Ottawa
Canadians
98.3%
3RD GRADE
99.8/ 100
METRIC RATING
46th/ 347
METRIC RANK
98.2%
3RD GRADE
99.6/ 100
METRIC RATING
69th/ 347
METRIC RANK
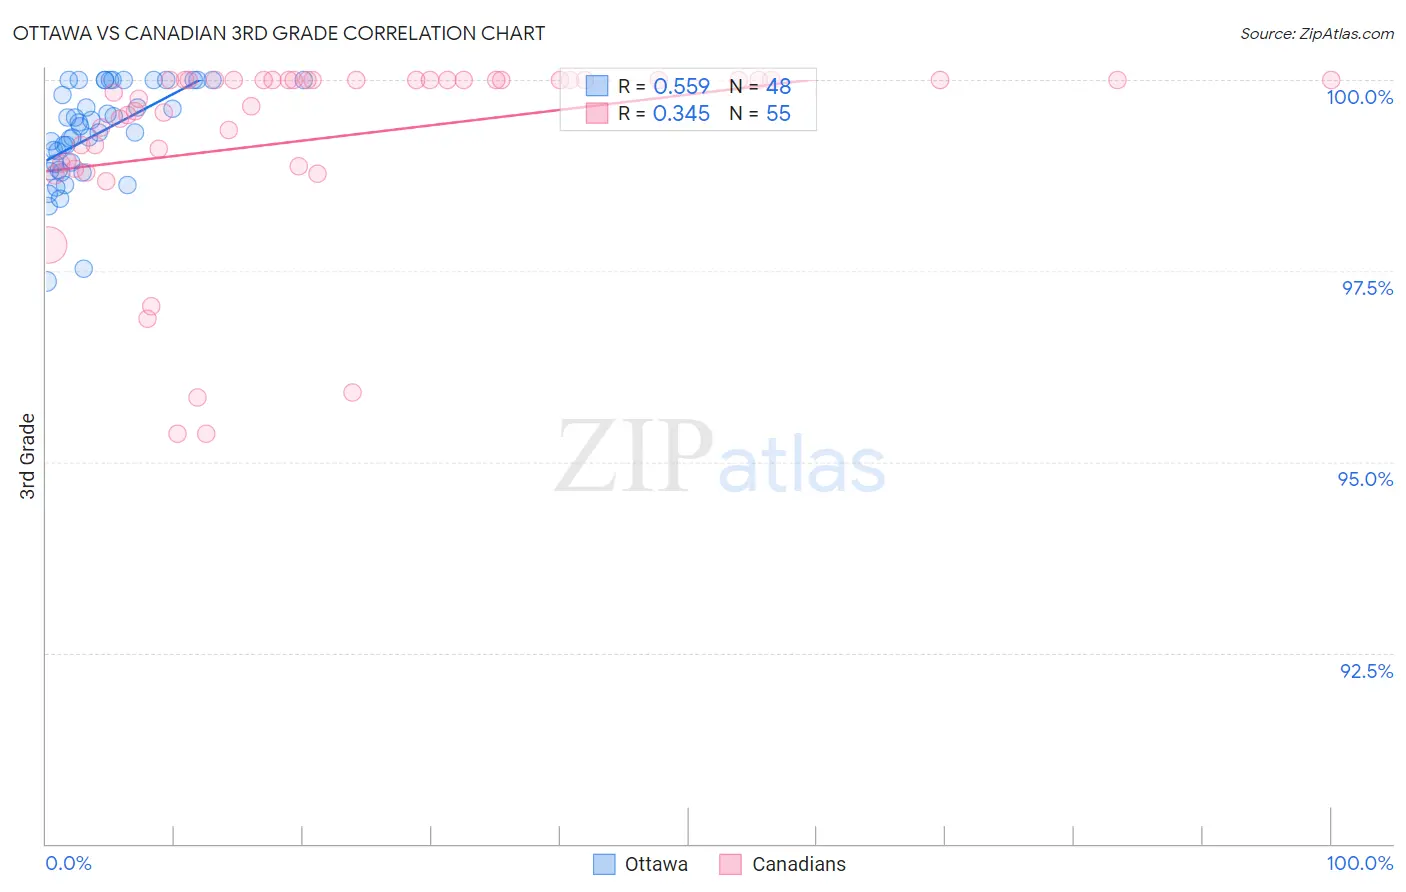
Ottawa vs Canadian 3rd Grade Correlation Chart
The statistical analysis conducted on geographies consisting of 49,956,726 people shows a substantial positive correlation between the proportion of Ottawa and percentage of population with at least 3rd grade education in the United States with a correlation coefficient (R) of 0.559 and weighted average of 98.3%. Similarly, the statistical analysis conducted on geographies consisting of 437,557,033 people shows a mild positive correlation between the proportion of Canadians and percentage of population with at least 3rd grade education in the United States with a correlation coefficient (R) of 0.345 and weighted average of 98.2%, a difference of 0.080%.
3rd Grade Correlation Summary
| Measurement | Ottawa | Canadian |
| Minimum | 97.4% | 95.4% |
| Maximum | 100.0% | 100.0% |
| Range | 2.6% | 4.6% |
| Mean | 99.3% | 99.2% |
| Median | 99.4% | 100.0% |
| Interquartile 25% (IQ1) | 98.9% | 98.9% |
| Interquartile 75% (IQ3) | 100.0% | 100.0% |
| Interquartile Range (IQR) | 1.1% | 1.1% |
| Standard Deviation (Sample) | 0.64% | 1.2% |
| Standard Deviation (Population) | 0.63% | 1.2% |
Similar Demographics by 3rd Grade
Demographics Similar to Ottawa by 3rd Grade
In terms of 3rd grade, the demographic groups most similar to Ottawa are Czechoslovakian (98.3%, a difference of 0.0%), Lumbee (98.3%, a difference of 0.010%), Native Hawaiian (98.3%, a difference of 0.020%), Estonian (98.3%, a difference of 0.020%), and Celtic (98.3%, a difference of 0.020%).
| Demographics | Rating | Rank | 3rd Grade |
| Latvians | 99.9 /100 | #39 | Exceptional 98.4% |
| Eastern Europeans | 99.9 /100 | #40 | Exceptional 98.3% |
| Luxembourgers | 99.9 /100 | #41 | Exceptional 98.3% |
| Belgians | 99.9 /100 | #42 | Exceptional 98.3% |
| Northern Europeans | 99.9 /100 | #43 | Exceptional 98.3% |
| Hungarians | 99.9 /100 | #44 | Exceptional 98.3% |
| Native Hawaiians | 99.9 /100 | #45 | Exceptional 98.3% |
| Ottawa | 99.8 /100 | #46 | Exceptional 98.3% |
| Czechoslovakians | 99.8 /100 | #47 | Exceptional 98.3% |
| Lumbee | 99.8 /100 | #48 | Exceptional 98.3% |
| Estonians | 99.8 /100 | #49 | Exceptional 98.3% |
| Celtics | 99.8 /100 | #50 | Exceptional 98.3% |
| Australians | 99.8 /100 | #51 | Exceptional 98.3% |
| Whites/Caucasians | 99.8 /100 | #52 | Exceptional 98.3% |
| Immigrants | Scotland | 99.8 /100 | #53 | Exceptional 98.3% |
Demographics Similar to Canadians by 3rd Grade
In terms of 3rd grade, the demographic groups most similar to Canadians are New Zealander (98.2%, a difference of 0.0%), Serbian (98.2%, a difference of 0.0%), Russian (98.2%, a difference of 0.0%), Immigrants from Northern Europe (98.2%, a difference of 0.0%), and Cajun (98.2%, a difference of 0.0%).
| Demographics | Rating | Rank | 3rd Grade |
| Immigrants | Canada | 99.7 /100 | #62 | Exceptional 98.2% |
| Immigrants | North America | 99.7 /100 | #63 | Exceptional 98.2% |
| Kiowa | 99.6 /100 | #64 | Exceptional 98.2% |
| New Zealanders | 99.6 /100 | #65 | Exceptional 98.2% |
| Serbians | 99.6 /100 | #66 | Exceptional 98.2% |
| Russians | 99.6 /100 | #67 | Exceptional 98.2% |
| Immigrants | Northern Europe | 99.6 /100 | #68 | Exceptional 98.2% |
| Canadians | 99.6 /100 | #69 | Exceptional 98.2% |
| Cajuns | 99.6 /100 | #70 | Exceptional 98.2% |
| Immigrants | Austria | 99.6 /100 | #71 | Exceptional 98.2% |
| Chickasaw | 99.5 /100 | #72 | Exceptional 98.2% |
| Cheyenne | 99.3 /100 | #73 | Exceptional 98.2% |
| Immigrants | Netherlands | 99.3 /100 | #74 | Exceptional 98.2% |
| Cherokee | 99.3 /100 | #75 | Exceptional 98.2% |
| Immigrants | England | 99.2 /100 | #76 | Exceptional 98.2% |