Osage vs Colville 4th Grade
COMPARE
Osage
Colville
4th Grade
4th Grade Comparison
Osage
Colville
98.0%
4TH GRADE
99.2/ 100
METRIC RATING
80th/ 347
METRIC RANK
97.7%
4TH GRADE
92.3/ 100
METRIC RATING
127th/ 347
METRIC RANK
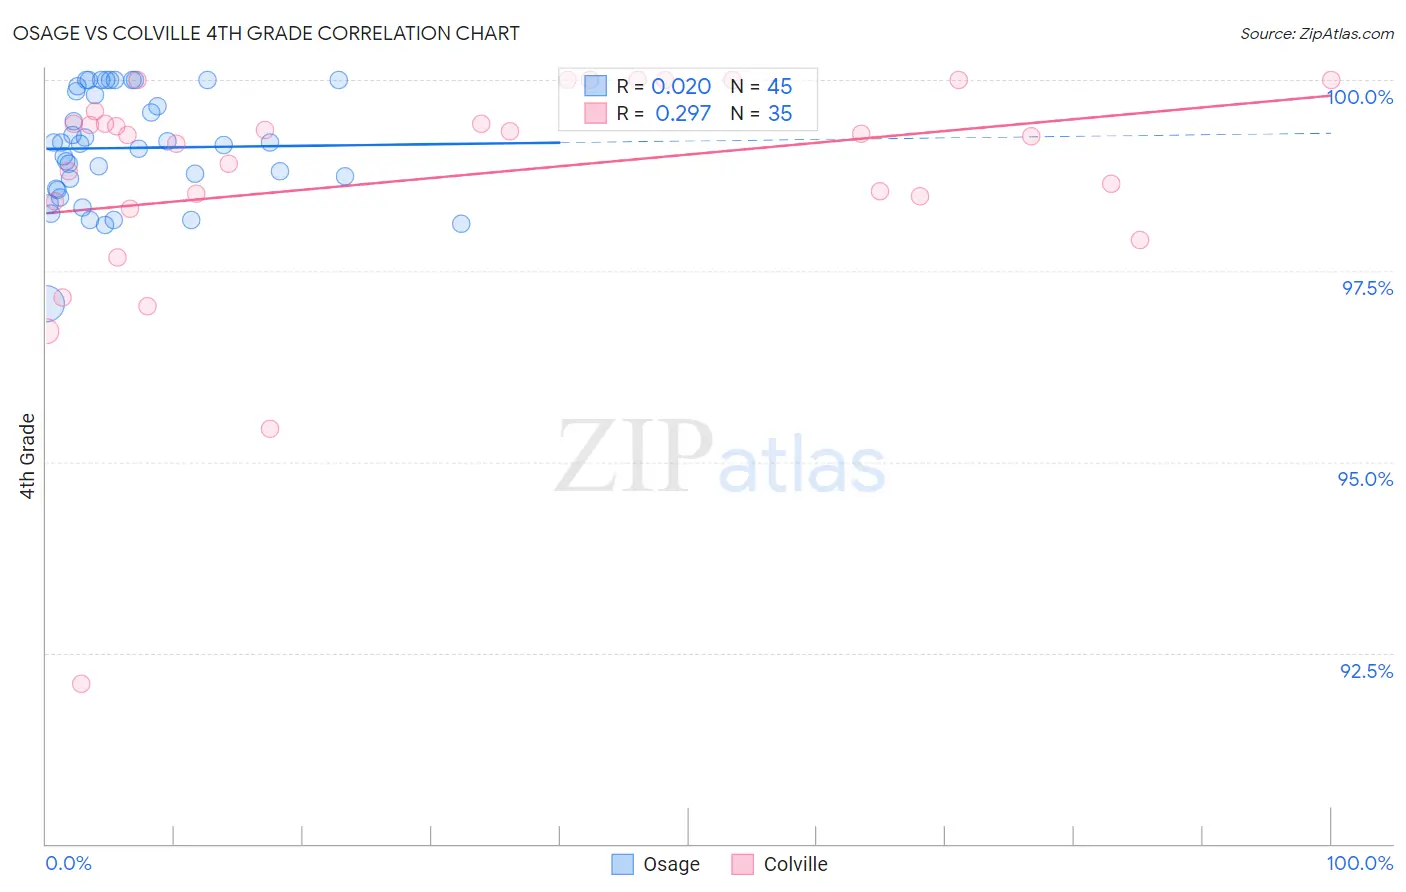
Osage vs Colville 4th Grade Correlation Chart
The statistical analysis conducted on geographies consisting of 91,808,929 people shows no correlation between the proportion of Osage and percentage of population with at least 4th grade education in the United States with a correlation coefficient (R) of 0.020 and weighted average of 98.0%. Similarly, the statistical analysis conducted on geographies consisting of 34,687,839 people shows a weak positive correlation between the proportion of Colville and percentage of population with at least 4th grade education in the United States with a correlation coefficient (R) of 0.297 and weighted average of 97.7%, a difference of 0.22%.
4th Grade Correlation Summary
| Measurement | Osage | Colville |
| Minimum | 97.1% | 92.1% |
| Maximum | 100.0% | 100.0% |
| Range | 2.9% | 7.9% |
| Mean | 99.1% | 98.7% |
| Median | 99.2% | 99.3% |
| Interquartile 25% (IQ1) | 98.6% | 98.4% |
| Interquartile 75% (IQ3) | 99.9% | 99.6% |
| Interquartile Range (IQR) | 1.3% | 1.2% |
| Standard Deviation (Sample) | 0.72% | 1.6% |
| Standard Deviation (Population) | 0.71% | 1.6% |
Similar Demographics by 4th Grade
Demographics Similar to Osage by 4th Grade
In terms of 4th grade, the demographic groups most similar to Osage are Ukrainian (98.0%, a difference of 0.0%), Immigrants from Netherlands (98.0%, a difference of 0.010%), Cherokee (98.0%, a difference of 0.010%), Immigrants from Lithuania (98.0%, a difference of 0.010%), and Immigrants from England (98.0%, a difference of 0.010%).
| Demographics | Rating | Rank | 4th Grade |
| Macedonians | 99.4 /100 | #73 | Exceptional 98.0% |
| Chickasaw | 99.4 /100 | #74 | Exceptional 98.0% |
| Immigrants | Netherlands | 99.3 /100 | #75 | Exceptional 98.0% |
| Cherokee | 99.3 /100 | #76 | Exceptional 98.0% |
| Immigrants | Lithuania | 99.3 /100 | #77 | Exceptional 98.0% |
| Immigrants | England | 99.3 /100 | #78 | Exceptional 98.0% |
| Ukrainians | 99.2 /100 | #79 | Exceptional 98.0% |
| Osage | 99.2 /100 | #80 | Exceptional 98.0% |
| Immigrants | India | 99.1 /100 | #81 | Exceptional 98.0% |
| Icelanders | 99.1 /100 | #82 | Exceptional 98.0% |
| Immigrants | Belgium | 99.0 /100 | #83 | Exceptional 97.9% |
| Cypriots | 98.9 /100 | #84 | Exceptional 97.9% |
| Potawatomi | 98.9 /100 | #85 | Exceptional 97.9% |
| Immigrants | Australia | 98.8 /100 | #86 | Exceptional 97.9% |
| Zimbabweans | 98.8 /100 | #87 | Exceptional 97.9% |
Demographics Similar to Colville by 4th Grade
In terms of 4th grade, the demographic groups most similar to Colville are Immigrants from Serbia (97.8%, a difference of 0.0%), Immigrants from Europe (97.8%, a difference of 0.0%), Pima (97.7%, a difference of 0.0%), Immigrants from Bulgaria (97.7%, a difference of 0.010%), and Immigrants from Zimbabwe (97.8%, a difference of 0.020%).
| Demographics | Rating | Rank | 4th Grade |
| Immigrants | France | 94.8 /100 | #120 | Exceptional 97.8% |
| Immigrants | Norway | 94.2 /100 | #121 | Exceptional 97.8% |
| Immigrants | Japan | 94.1 /100 | #122 | Exceptional 97.8% |
| Immigrants | Zimbabwe | 93.9 /100 | #123 | Exceptional 97.8% |
| Spanish | 93.7 /100 | #124 | Exceptional 97.8% |
| Immigrants | Serbia | 92.6 /100 | #125 | Exceptional 97.8% |
| Immigrants | Europe | 92.5 /100 | #126 | Exceptional 97.8% |
| Colville | 92.3 /100 | #127 | Exceptional 97.7% |
| Pima | 92.0 /100 | #128 | Exceptional 97.7% |
| Immigrants | Bulgaria | 91.3 /100 | #129 | Exceptional 97.7% |
| Immigrants | Romania | 90.6 /100 | #130 | Exceptional 97.7% |
| Immigrants | Kuwait | 89.7 /100 | #131 | Excellent 97.7% |
| Immigrants | Hungary | 89.3 /100 | #132 | Excellent 97.7% |
| Hmong | 88.2 /100 | #133 | Excellent 97.7% |
| Palestinians | 88.1 /100 | #134 | Excellent 97.7% |